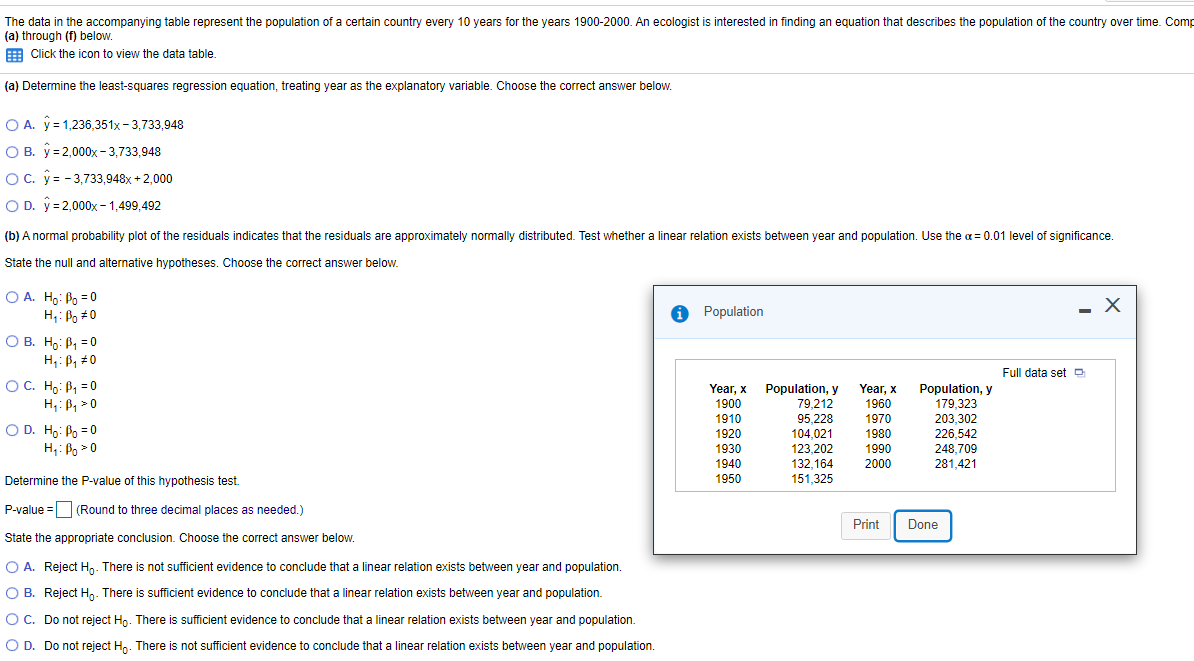
a) Determine the least-squares regression equation, treating year as the explanatory variable. Choose the correct answer below. OA. ý = 1,236,351x- 3,733,948 в. у- 2,000х -3,733,948 OC. ý = - 3,733,948x + 2,000 O D. ý = 2,000x - 1,499,492 b) A normal probability plot of the residuals indicates that the residuals are approximately normally distributed. Test whether a linear relation exists between year and population. Use the a = 0.01 level of significance State the null and alternative hypotheses. Choose the correct answer below. DA. Ho: Po =0 H,: Po #0 Population O B. Ho: B, =0 H: B, #0 Full data set O DC. Ho: P, =0 H,: B, >0 Year, x 1900 1910 1920 1930 1940 1950 Population, y 79,212 95,228 104.021 123,202 132,164 151,325 Year, x 1960 1970 1980 1990 2000 Population, y 179.323 203,302 226,542 248,709 281,421 D D. Ho: Po = 0 Determine the P-value of this hypothesis test. -value = (Round to three decimal places as needed.) Print Done State the appropriate conclusion. Choose the correct answer below. O A. Reject H,: There is not sufficient evidence to conclude that a linear relation exists between year and population. O B. Reject H,. There is sufficient evidence to conclude that a linear relation exists between year and population. O C. Do not reject Ho. There is sufficient evidence to conclude that a linear relation exists between year and population. O D. Do not reject Hn. There is not sufficient evidence to conclude that a linear relation exists between year and population.


Correlation
Correlation defines a relationship between two independent variables. It tells the degree to which variables move in relation to each other. When two sets of data are related to each other, there is a correlation between them.
Linear Correlation
A correlation is used to determine the relationships between numerical and categorical variables. In other words, it is an indicator of how things are connected to one another. The correlation analysis is the study of how variables are related.
Regression Analysis
Regression analysis is a statistical method in which it estimates the relationship between a dependent variable and one or more independent variable. In simple terms dependent variable is called as outcome variable and independent variable is called as predictors. Regression analysis is one of the methods to find the trends in data. The independent variable used in Regression analysis is named Predictor variable. It offers data of an associated dependent variable regarding a particular outcome.


Trending now
This is a popular solution!

Step by step
Solved in 2 steps with 2 images


