(a) Draw the scatter-plot and then write the equation of the regression line that fits the best. (b) What is the value of the slope of the line? Interpret. (c) What is the y-intercept? Interpret.
(a) Draw the scatter-plot and then write the equation of the regression line that fits the best. (b) What is the value of the slope of the line? Interpret. (c) What is the y-intercept? Interpret.

Chapter4: Linear Functions
Section: Chapter Questions
Problem 41RE: For the following exercises, consider the data in Table 5, which shows the percent of unemployed in...

Related questions
Topic Video
Question
Can you guys explain and help me out with those questions, please?
Thanks.
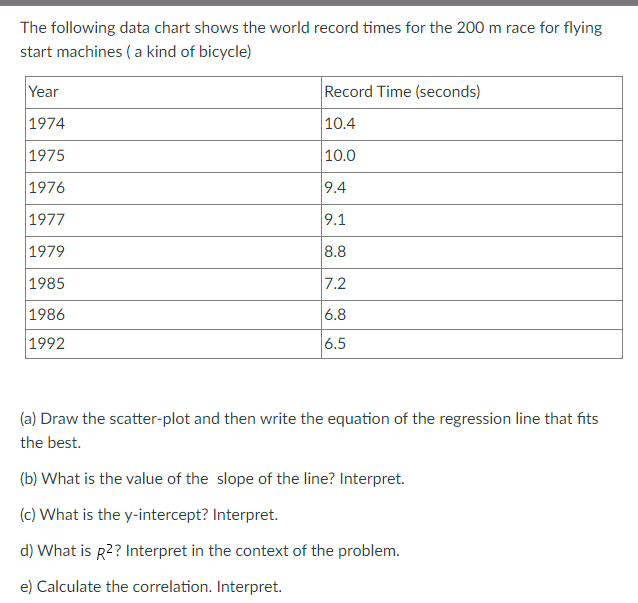
Transcribed Image Text:The following data chart shows the world record times for the 200 m race for flying
start machines ( a kind of bicycle)
Year
Record Time (seconds)
1974
10.4
1975
10.0
1976
9.4
1977
9.1
1979
8.8
1985
7.2
1986
6.8
1992
6.5
(a) Draw the scatter-plot and then write the equation of the regression line that fits
the best.
(b) What is the value of the slope of the line? Interpret.
(c) What is the y-intercept? Interpret.
d) What is R2? Interpret in the context of the problem.
e) Calculate the correlation. Interpret.
Expert Solution
This question has been solved!
Explore an expertly crafted, step-by-step solution for a thorough understanding of key concepts.

This is a popular solution!

Trending now
This is a popular solution!

Step by step
Solved in 3 steps with 1 images

Knowledge Booster


Learn more about
Need a deep-dive on the concept behind this application? Look no further. Learn more about this topic, statistics and related others by exploring similar questions and additional content below.Recommended textbooks for you

Glencoe Algebra 1, Student Edition, 9780079039897…
Algebra
ISBN:
9780079039897
Author:
Carter
Publisher:
McGraw Hill

Linear Algebra: A Modern Introduction
Algebra
ISBN:
9781285463247
Author:
David Poole
Publisher:
Cengage Learning
Glencoe Algebra 1, Student Edition, 9780079039897…
Algebra
ISBN:
9780079039897
Author:
Carter
Publisher:
McGraw Hill
Linear Algebra: A Modern Introduction
Algebra
ISBN:
9781285463247
Author:
David Poole
Publisher:
Cengage Learning

Functions and Change: A Modeling Approach to Coll…
Algebra
ISBN:
9781337111348
Author:
Bruce Crauder, Benny Evans, Alan Noell
Publisher:
Cengage Learning