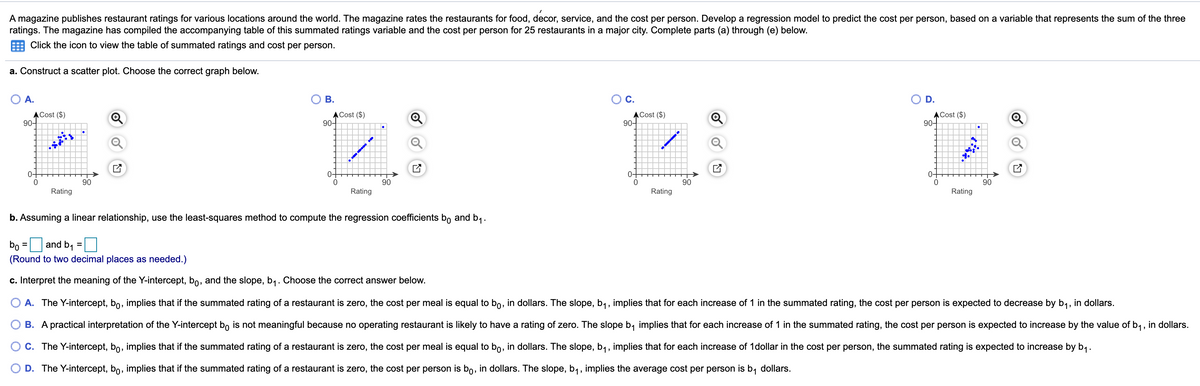
A magazine publishes restaurant ratings for various locations around the world. The magazine rates the restaurants for food, decor, service, and the cost per person. Develop a regression model to predict the cost per person, based on a variable that represents the sum of the three ratings. The magazine has compiled the accompanying table of this summated ratings variable and the cost per person for 25 restaurants in a major city. Complete parts (a) through (e) below. E Click the icon to view the table of summated ratings and cost per person. a. Construct a scatter plot. Choose the correct graph below. O A. OB. Oc. OD. ACost (S) 90- A Cost (S) 90- ACost (5) 90 ACost (S) Rating Rating Rating Rating b. Assuming a linear relationship, use the least-squares method to compute the regression coefficients bo and b;. Do =D and b, =O (Round to two decimal places as needed.) c. Interpret the meaning of the Y-intercept, bo, and the slope, b,. Choose the correct answer below. O A. The Y-intercept, bo, implies that if the summated rating of a restaurant is zero, the cost per meal is equal to bo, in dollars. The slope, b,, implies that for each increase of 1 in the summated rating, the cost per person is expected to decrease by b;, in dollars. O B. A practical interpretation of the Y-intercept bo is not meaningful because no operating restaurant is likely to have a rating of zero. The slope b; implies that for each increase of 1 in the summated rating, the cost per person is expected to increase by the value of b,, in dollars. OC. The Y-intercept, bo. implies that if the summated rating of a restaurant is zero, the cost per meal is equal to bo, in dollars. The slope, b1, implies that for each increase of 1dollar in the cost per person, the summated rating is expected to increase by b, OD. The Y-intercept, bo, implies that if the summated rating of a restaurant is zero, the cost per person is bo, in dollars. The slope, b,. implies the average cost per person is b, dollars.


Correlation
Correlation defines a relationship between two independent variables. It tells the degree to which variables move in relation to each other. When two sets of data are related to each other, there is a correlation between them.
Linear Correlation
A correlation is used to determine the relationships between numerical and categorical variables. In other words, it is an indicator of how things are connected to one another. The correlation analysis is the study of how variables are related.
Regression Analysis
Regression analysis is a statistical method in which it estimates the relationship between a dependent variable and one or more independent variable. In simple terms dependent variable is called as outcome variable and independent variable is called as predictors. Regression analysis is one of the methods to find the trends in data. The independent variable used in Regression analysis is named Predictor variable. It offers data of an associated dependent variable regarding a particular outcome.


Trending now
This is a popular solution!

Step by step
Solved in 2 steps with 2 images


