A factory ships sunglasses in boxes that each have the same number of sunglasses. The table shows the data for 4 shipments. Number of Number of Вохes Sunglasses 2 50 75 125 175 Which rate represents the relationship in the table? A. 225 sunglasses per 8 boxes В. 100 sunglasses per 4 boxes С. 5 sunglasses per 125 boxes D. 4 sunglasses per 100 boxes
A factory ships sunglasses in boxes that each have the same number of sunglasses. The table shows the data for 4 shipments. Number of Number of Вохes Sunglasses 2 50 75 125 175 Which rate represents the relationship in the table? A. 225 sunglasses per 8 boxes В. 100 sunglasses per 4 boxes С. 5 sunglasses per 125 boxes D. 4 sunglasses per 100 boxes

Glencoe Algebra 1, Student Edition, 9780079039897, 0079039898, 2018
18th Edition
ISBN:9780079039897
Author:Carter
Publisher:Carter
Chapter10: Statistics
Section10.6: Summarizing Categorical Data
Problem 27PPS

Related questions

Concept explainers
Equations and Inequations
Equations and inequalities describe the relationship between two mathematical expressions.
Linear Functions
A linear function can just be a constant, or it can be the constant multiplied with the variable like x or y. If the variables are of the form, x2, x1/2 or y2 it is not linear. The exponent over the variables should always be 1.
Question
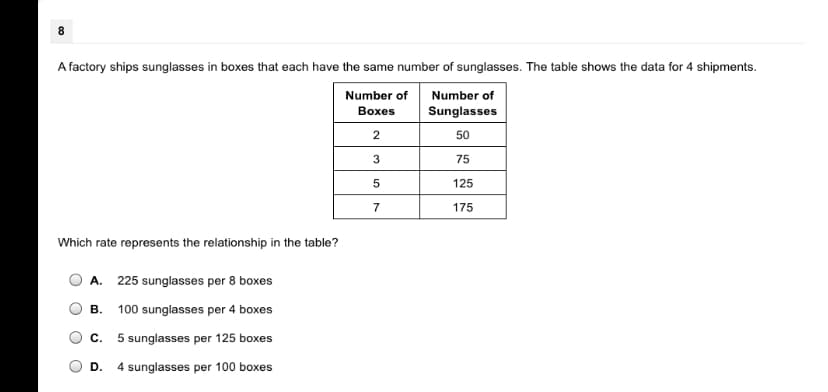
Transcribed Image Text:8.
A factory ships sunglasses in boxes that each have the same number of sunglasses. The table shows the data for 4 shipments.
Number of
Number of
Вохes
Sunglasses
2
50
3
75
125
7
175
Which rate represents the relationship in the table?
A. 225 sunglasses per 8 boxes
В.
100 sunglasses per 4 boxes
С.
5 sunglasses per 125 boxes
D.
4 sunglasses per 100 boxes
Expert Solution
This question has been solved!
Explore an expertly crafted, step-by-step solution for a thorough understanding of key concepts.

This is a popular solution!

Trending now
This is a popular solution!

Step by step
Solved in 2 steps

Knowledge Booster


Learn more about
Need a deep-dive on the concept behind this application? Look no further. Learn more about this topic, statistics and related others by exploring similar questions and additional content below.Recommended textbooks for you
Glencoe Algebra 1, Student Edition, 9780079039897…
Algebra
ISBN:
9780079039897
Author:
Carter
Publisher:
McGraw Hill
Glencoe Algebra 1, Student Edition, 9780079039897…
Algebra
ISBN:
9780079039897
Author:
Carter
Publisher:
McGraw Hill