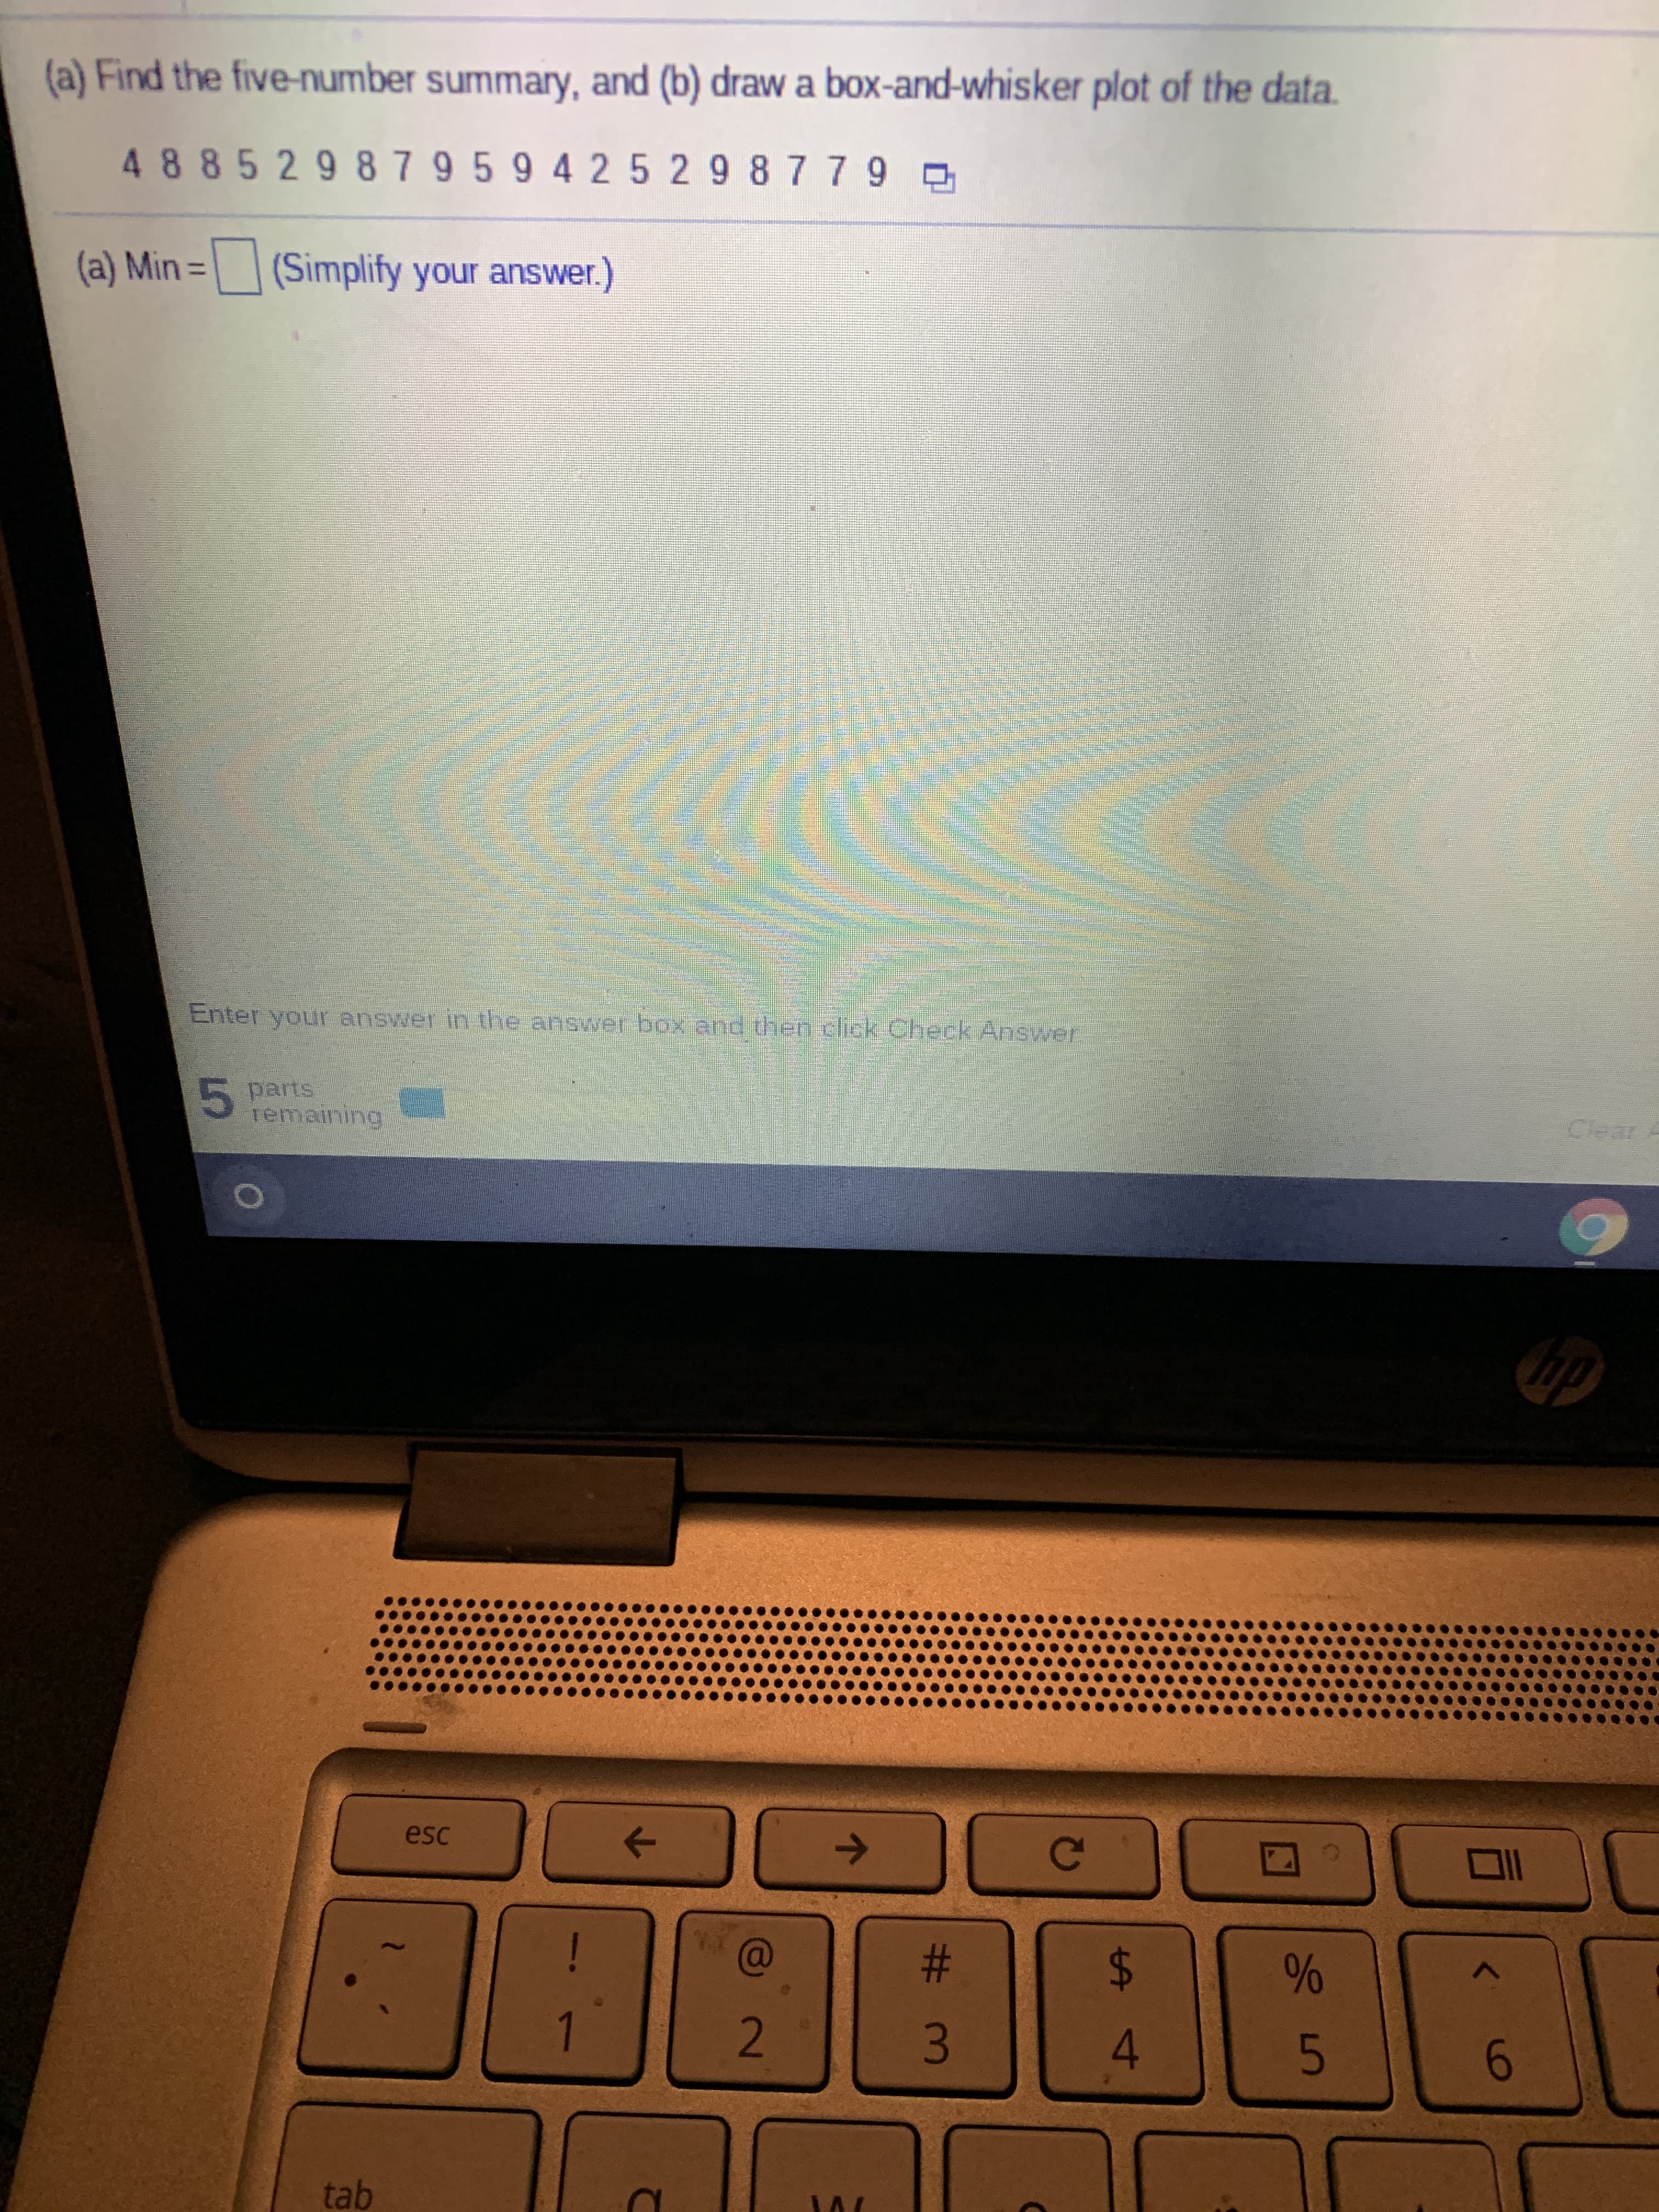
(a) Find the five-number summary, and (b) draw a box-and-whisker plot of the data. 48852987959425 29 8779 D (a) Min = (Simplify your answer.)


Q: The data to the right shows the number of graduating students with business majors at a university…
A: The arranged data (in ascending order) is given as: 183 189 194 201 206 213 220 226…
Q: The data represents the heights of eruptions by a geyser. Height of eruption (in.) 50 900 40 70 50…
A: Stem leaf plot which splits the data into stem and leaf. Where stem is the first value anfd leaf is…
Q: An oceanographer took readings of the water temperatures C (in degrees Celsius) at several depths d…
A:
Q: Scores on an accounting exam ranged from 45 to 94. with quartiles Q1= 52.00. Q2=56.5, and Q3= 7775.…
A: a) Given Data: Range=45 to 94 Q1=52 Q2=56.5 Q3=77.75 Box Plot A represents the data correctly…
Q: The stem-and-leaf plot below shows test scores for 25 students. Test Scores Stem Leaf 357 24689…
A: Given key is 5|3=53 5|3 5 7 =53,55,57 6|2 4 6 8 9 =62,64,66,68,69 7|1 3 3 5 5 5 6 7 8…
Q: 5 27 5 1 14 a. List the five-number summary. b. Construct a box-and-whisker plot and describe the…
A:
Q: A researcher wanted to determine the number of televisions in households. He 1 1 3 3 3 4 10 conducts…
A: A Dot Plot is a type of simple histogram-like chart used in statistics for relatively small data…
Q: Floor Space (sq. ft.) Weekly Sales (dollars) 6,060 16,380 5,230 14,400 4,280 13,820 5,580 18,230…
A: x y 6,060 16,380 5,230 14,400 4,280 13,820 5,580 18,230 5,670 14,200 5,020 12,800…
Q: (a) Find the five-number summary, and (b) draw a box-and-whisker plot of the data. 38 85 2987…
A: Given data is3,8,8,5,2,9,8,7,9,6,9,4,1,6,2,9,8,7,7,9sample size(n)=20
Q: The data represents the heights of eruptions by a geyser. Height of eruption (in.) 62 33 50 900 Use…
A:
Q: 1. Describe the differences between a histogram and a dot plot. When might a dôt plot be better than…
A: 1. Histograms are constructed using class intervals and they show the frequency of the data which…
Q: (a) Find the five-number summary, and (b) draw a box-and-whisker plot of the data. 488529879 69 4 26…
A:
Q: (a) Find the five-number summary, and (b) draw a box-and-whisker plot of the data. 4886298796942629…
A: The data is arranged in ascending order as shown below: 2, 2, 2, 4, 4, 6, 6, 6, 7, 7, 7, 8, 8, 8, 8,…
Q: The nine measurements that follow are furnace temperatures recorded on successive batches in a…
A: The box plot is used to depict the distribution of dataset. For vertical box plots, the lower end is…
Q: Mars, Inc. states that 16% of all milk chocolate M&M’S® produced are green. A group of students took…
A: 1)Given20 samples of M&Ms with sample size 3020 samples of M&Ms with sample size 60. To…
Q: Use a stem-and-leaf plot to display the data, which represent the scores of a biology class on a…
A: Given data, 75 85 90 80 87 65 82 88 95 91 72 80 81 92 94 68 75 91 90 87 76 91 85 89
Q: Exam Score Data 76 90 69 86 64 77 75 79 70 82 80 62 96 76 51 65 64 68 95 74 5c) Make a…
A: Data in ascending order, 51, 62, 64, 64, 65, 68, 69, 70, 74, 75, 76, 76, 77, 79, 80, 82, 86 90, 95,…
Q: The data show the number of vacation days used by a sample of 20 employees in a recent year. Use…
A: Arrange the given data in ascending order 0, 1, 1, 2, 2, 2, 2, 2, 4, 5, 5, 5, 6, 6, 7, 7, 7, 8, 8,…
Q: A baseball is thrown upward, and its height measured at 0.5-second intervals using a strobe light.…
A: Given data is Time (s) Height (feet) 0 4.2 0.5 26.1 1.0 40.1 1.5 46.0 2.0 43.9 2.5…
Q: The box-and-whisker plots below show the scores earned by 6th and 7th graders on a year-end reading…
A: The scores earned by 6th and 7th graders on a year ending reading test is shown through the box and…
Q: The stem-and-leaf plot below shows test scores for 25 students. Test Scores Stem Leaf 357 6. 2 4 6…
A: From given stem and leaf plot the data values…
Q: Öld A group of third grade students is taught using a new curriculum. A control group of third grade…
A:
Q: A scatter plot puts the independent data along the horizontal axis. O True O False
A: Solution
Q: (a) Find the five-number summary, and (b) draw a box-and-whisker plot of the data. 3886298 79…
A: Given data set3,8,8,6,2,9,8,7,9,6,9,4,2,6,2,9,8,7,7,9
Q: The nine measurements that follow are furnace temperatures recorded on successive batches in a…
A:
Q: 22 inbound and outbound airplanes. Use technology to answer parts (a) and (b). a. Find the data…
A: Arrange the data in ascending order. S.no. x 1 2.2 2 2.4 3 2.6 4 2.8 5 2.9 6 3.1 7…
Q: (a) Find the five-number summary, and (b) draw a box-and-whisker plot of the data. 488629879 69526…
A: The given data is 4,8,8,6,2,9,8,7,9,6,9,5,2,6,2,9,8,7,7,9. Arranging the data in ascending order, 2…
Q: Scores on an accounting exam ranged from 44 to 96, with quartiles Q1=60.00, Q2=84.5, and Q3=88.50.…
A: Given information Quartiles Q1 = 60.0 Q2 = 84.5 Q3 = 88.50 a) Correct boxplot is Boxplot A
Q: Here is a data set: 40 61 44 51 53 79 50 52 50 52 74 61 46 51 54 50 51 40 78 52 61 42 56 52 44 65 42…
A: Stem and leaf plot: The stem plot and histogram will display the similar pattern of graph. Addition…
Q: The data represents the heights of eruptions by a geyser. Use the heights to construct a stemplot.…
A: Given data of heights of eruptions by a geyser given in inches61 32 50 90 80 50 40 70 50 61 73 56 59…
Q: The data show the number of hours spent studying per day by a sample of 28 students. Use the…
A: We have given box and whisker plot
Q: The data to the right shows the number of graduating students with business majorn at a university…
A:
Q: (a) Find the five-number summary, and (b) draw a box-and-whisker plot of the data.…
A: Given data is3,8,8,5,2,9,8,7,9,6,9,4,1,6,2,9,8,7,7,9n = 20
Q: The data show the distance (in miles) from an airport of a sample of 22 inbound and outbound…
A:
Q: A researcher measures the relationship between education (in years) and investment gains (in…
A: a. The scatter plot with the line of best fit can be obtained using EXCEL software. Enter the…
Q: The data show the number of vacation days used by a sample of 20 employees in a recent year. Use…
A: Solution-: Given data: 1,5,4,3,6,0,5,3,4,5,3,1,10,7,8,6,1,2,8,9 We find, (a) Three quartiles (b)…
Q: A scatter plot puts the dependent data along the horizontal axis. O True O False
A:
Q: (a) Find the five-number summary, and (b) draw a box-and-whisker plot of the data 388429 8 69 49…
A: Introduction: The five-number summary includes the minimum, first quartile, second quartile…
Q: The data to the right shows the number of graduating students with business majors at a university…
A: Given data : 277,247,224,197,269,241,214,187,263,236,208,182,256,230,202
Q: Sdved Scores on an accounting exam ranged from 44 to 91, with quartiles O; = 54.25, Q2=61.5, and Q3=…
A: Given, Q1=54.25 Q2=61.5 Q3=79.25
Q: You are examining the data with a stem-and-leaf plot. Here is the start of the plot. Finish the…
A: Here it is asked to find leaf for the given stem is equal to 7. First step is to arrange the data…
Q: Next question (a) Find the five-number summary, and ) draw a box and whaker plot of he data work…
A:
Q: The data to the right shows the number of graduating students with business majors at a university…
A: option C
Q: 8 The box plot describes the peaches harvested from trees in an orchard. Peach Harvest 85 100 115…
A:
Q: Here is a data set: 31 53 32 42 59 37 46 48 30 44 43 61 44 48 42 58 45 41 53 62 34 45 38 45 57 65 43…
A:
Q: (a) Find the five-number summary, and (b) draw a box-and-whisker plot of the data. 48852987959 4 25…
A: The given data is 4, 8, 8, 5, 2, 9, 8, 7, 9, 5, 9, 4, 2, 5, 2, 9, 8, 7, 7, and 9.
Q: (a) Find the five-number summary, and (b) draw a box-and-whisker plot of the data. 48852987 9 5 9 4…
A: The given dataset is: 4 8 8 5 2 9 8 7 9 5 9 4 2 5 2 9 8 7 7…
Q: use the stem-and-leaf plot at the right th ne costs of various DVD players at an electronics store.…
A: 5. Given is the stem and leaf plot, where the first column shows the data points' initial digits,…
Q: Scores on an accounting exam ranged from 45 to 94, with quartiles Q1= 61.25, Q2= 63.0, and Q3= 7775.…
A:
Q: Scores on an accounting exam ranged from 44 to 91, with quartiles Q1= 54.25, Q2=61.5, and Q3=79.25.…
A: Given, The five number summary, Minimum=44Q1=54.25Q2=61.5Q3=79.25Maximum=91


Trending now
This is a popular solution!

Step by step
Solved in 3 steps with 6 images


- A researcher measures the relationship between education (in years) and investment gains (in thousands of dollars). Answer the following questions based on the results provided. SP = 16.25. a. Create a scatter plot of the data & Calculate r and r2b. Report results in APA style & What do results mean? Education Investment Gains 14 8 12 11 9 10 18 142. A researcher measures the relationship between education (in years) and investment gains (in thousands of dollars). Answer the following questions based on the results provided. SP = 16.25.a. Create a scatter plot of the datab. Calculate r and r2c. Report results in APA style.d. What do results meanThe power of the slope t-test is NOT determined by: A)direction of slope B) sample size C) effect size D) alpha
- Which value of r would be appropriate for the scatter plot shown? 1. 0.4 2. 0.0 3. -0.4 4. 0.9Please help me solve this practice question, # of vacation days 5 3 9 2 50 22 7 3 2 2 6 4 0 15 0 15 0 3 20 8 6 5 0 0 1 1 H) Construct the box-and- whisker plot that represents the data. Format it and display the data label (Q1, Q2, Q3, …. ) on the boxplot I) Comment on the shape of the distribution(symmetric, left-skewed, right-skewed)A used car company believes that there is a relationship between the amount spent on advertising and its sales. Data collected for 6 years are as follow: Amount spent on advertising Sales ($thousands) ($millions) 2.0 1 3.0 3 2.5 4 2.0 2 2.0 1 3.5 7 1. Illustrate the above on a scatter plot.
- Mars, Inc. states that 16% of all milk chocolate M&M’S® produced are green. A group of students took the following samples from a bowl of 500 mixed up M&M’S®. (see attached) What information do we need in order to answer our question or investigate the claim that 16% of milk chocolate M&M’S® produced by Mars, Inc. are green? How can we use the samples of M&M’S® to obtain this information? What value is at the center of the dot plot constructed by using one sample per group? Is it a coincidence that the value is close to/far from the 16% claimed by Mars, Incorporated? Mars, Inc. claimed that 16% of milk chocolate M&M’S® produced are green. Does the information on the dot plot seem to support this claim? Why or why not?My data-price column 3850 3999 5289 5800 5995 6495 6823 6897 6980 6999 6999 7500 7995 8199 8883 8989 8995 9000 9800 9991 10999 11999 12212 12900 13490 14499 15849 17500 18723 20990 Using the price column, recall your box plot from Part 2 and compute the 5 number summary of your data. Find the z score that corresponds to the first quartile. What probability corresponds to this z score? Find the z score that corresponds to the third quartile. What probability corresponds to this z score? In your own words (using complete sentences) describe why these probabilities make sense. (Hint: How do the box plot and the z table relate to one another?)A study is made of the relationship between annual production volume of Good A and factory floor area. Table below shows the data from a sample of 10 factories. Factory Factory floor area, X (‘000m2 ) Annual production volume, Y ($‘ 000) 1 40 3.5 2 600 25.0 3 60 4.8 4 72 3.5 5 400 30.0 6 90 5.0 7 200 12.0 8 70 4.5 9 80 5.0 10 84 6.0 Construct a scatter plot.
- One factor in the development of tennis elbow, a malady that strikes fear in the hearts of all serious tennis players, is the impact-induced vibration of the racket-and-arm system at ball contact. It is well known that the likelihood of getting tennis elbow depends on various properties of the racket used. Consider the scatter plot of x = racket resonance frequency (Hz) and y = sum of peak-to-peak acceleration (a characteristic of arm vibration, in m/sec/sec) for n = 23 different rackets.† Discuss interesting features of the data and scatter plot.Use the sample data given in tablex 1 2 3 4 5y 3 4 1 2 1a) To Write the regression equation ̂y=mx+bb) Plot the regression equation and the scatter diagram on the same graph6) part 4. Generate a abo plot for the asteroid data.


