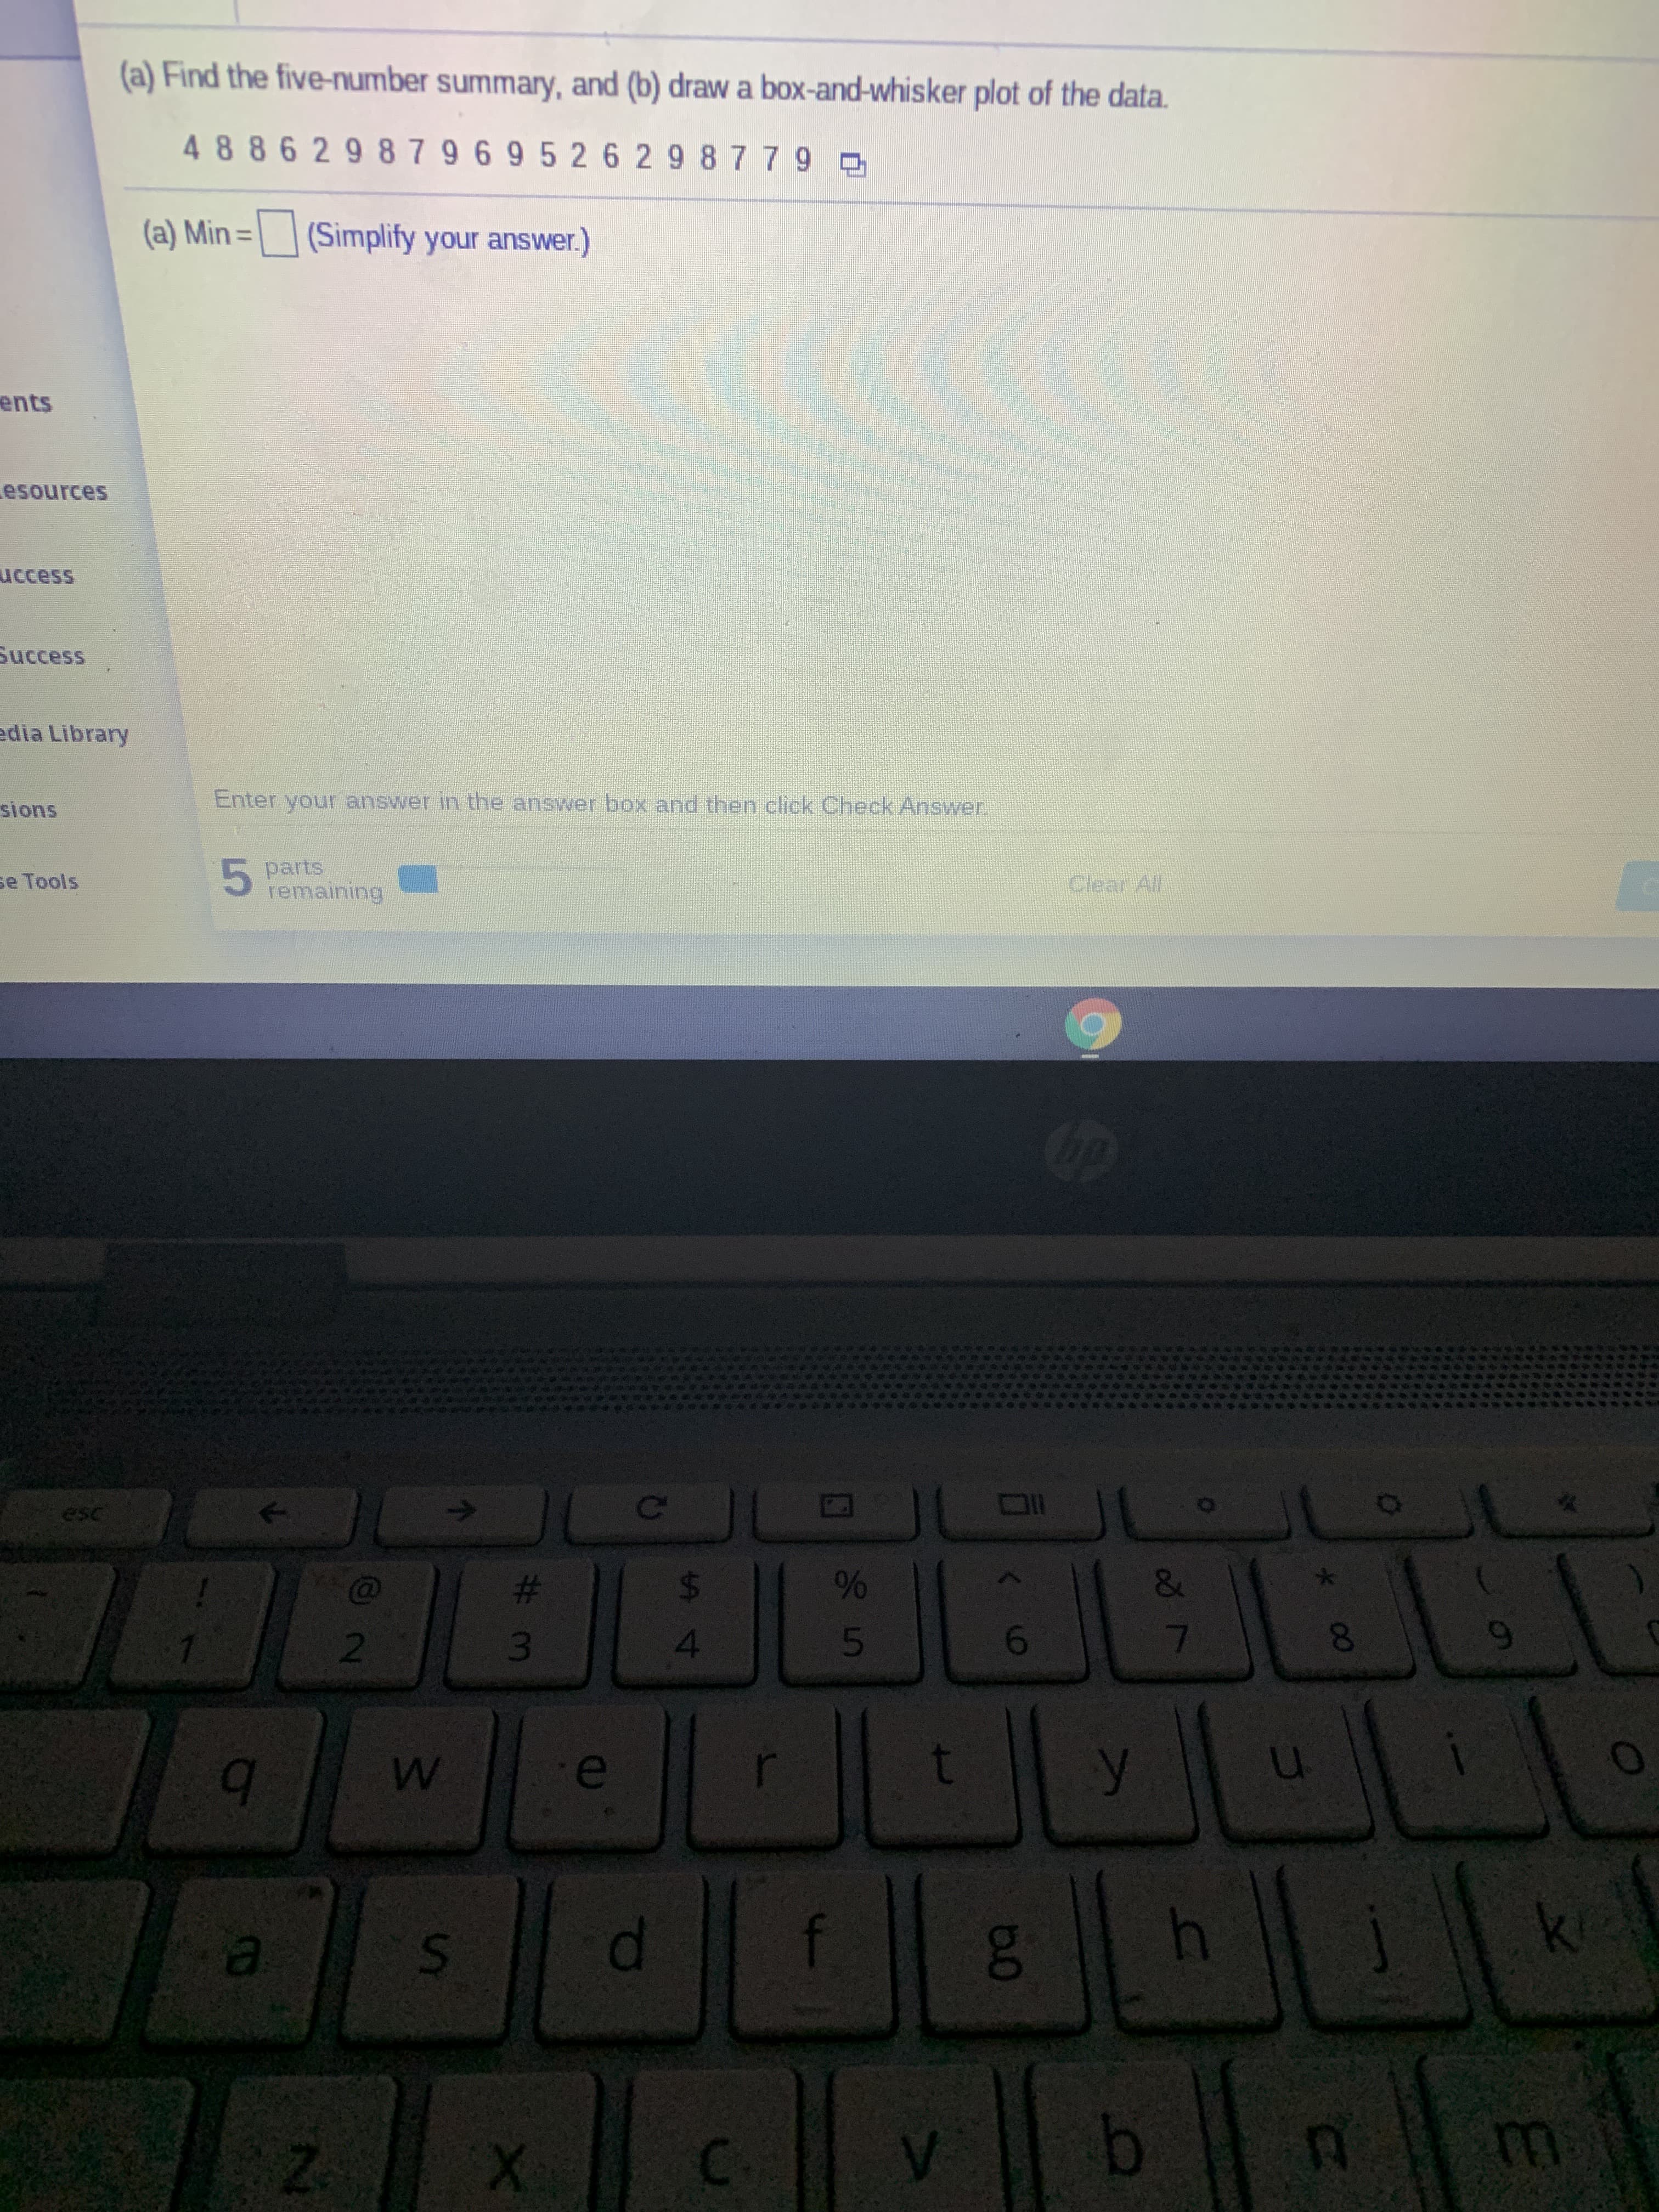
(a) Find the five-number summary, and (b) draw a box-and-whisker plot of the data. 488629879 69526 29 8779 0 (a) Min=| | (Simplify your answer.)


Q: The data to the right shows the number of graduating students with business majors at a university…
A: The arranged data (in ascending order) is given as: 183 189 194 201 206 213 220 226…
Q: The data represents the heights of eruptions by a geyser. Height of eruption (in.) 50 900 40 70 50…
A: Stem leaf plot which splits the data into stem and leaf. Where stem is the first value anfd leaf is…
Q: Question 6 Using the dot-plot below, name the outlier. Your answer: O 2 O 5 O 10 O 6
A: 10
Q: answer questions 1 – 4. After a company celebrated its ten year anniversary, the president of the…
A: topic - median of data
Q: 5 27 5 1 14 a. List the five-number summary. b. Construct a box-and-whisker plot and describe the…
A:
Q: A researcher wanted to determine the number of televisions in households. He 1 1 3 3 3 4 10 conducts…
A: A Dot Plot is a type of simple histogram-like chart used in statistics for relatively small data…
Q: The amounts A (in billions of dollars) donated to support higher education in the United States from…
A: To create the scatter plot proceed as follows Take year on the x - axis and amount on y- axis and…
Q: (a) Find the five-number summary, and (b) draw a box-and-whisker plot of the data. 38 85 2987…
A: Given data is3,8,8,5,2,9,8,7,9,6,9,4,1,6,2,9,8,7,7,9sample size(n)=20
Q: (a) Find the five-number summary, and (b) draw a box-and-whisker plot of the data. 488529 879 6 9 42…
A: Solution-: Given data: xi:4,8,8,5,2,9,8,7,9,6,9,4,2,6,2,9,8,7,7,9 We find,…
Q: ou are examining the data with a stem-and-leaf plot. Here is the start of the plot. Finish the plot.…
A: Given Data: 59 61 40 50 71 40 56 57 46 55 47 50 49 57 75 46 50 58 53 57 59 68 59 48 69…
Q: The box-and-whisker plots show the tests scores of two different algebra classes. Compare and…
A: INTRODUCTION: Box Plot: it is one of the tools of the statistical method. In which we get the…
Q: The data represents the heights of eruptions by a geyser. Height of eruption (in.) 62 33 50 900 Use…
A:
Q: Here is a data set: 10 30 49 20 12 14 23 14 29 32 20 23 20 29 23 19 33 14 36 21 25 26 18 17 47 27 24…
A: Here given data set is 10 30 49 20 12 14 23 14 29 32 20 23 20 29 23 19 33 14 36 21 25 26…
Q: (a) Find the five-number summary, and (b) draw a box-and-whisker plot of the data. 488529879 69 4 26…
A:
Q: Find the five-number summary, and (b) draw a box-and-whisker plot of the data 4 88 6 29 879 6 9 5 2…
A: Given 4,8,8,6,2,9,8,7,9,6,9,5,2,6,2,9,8,7,7,9
Q: Health Care: Staff Another survey was done at Center Hospital to determine how long (in months)…
A: Given The responses (in months) of 20 clerical staff members
Q: (a) Find the five-number summary, and (b) draw a box-and-whisker plot of the data. 4886298796942629…
A: The data is arranged in ascending order as shown below: 2, 2, 2, 4, 4, 6, 6, 6, 7, 7, 7, 8, 8, 8, 8,…
Q: (a) Find the five-number summary, and (b) draw a box-and-whisker plot of the data. 3 88 619 87969 3…
A: (a) Obtain the values of five number summary. The values of five number summary is obtained…
Q: Here is a data set: 36 21 59 36 36 38 39 26 33 45 34 26 41 38 35 25 24 24 32 33 45 58 29 44 30 34 31…
A: We have to find given blank..
Q: Use a stem-and-leaf plot to display the data, which represent the scores of a biology class on a…
A: Given data, 75 85 90 80 87 65 82 88 95 91 72 80 81 92 94 68 75 91 90 87 76 91 85 89
Q: The data represents the heights of eruptions by a geyser. Height of eruption (in.) 69 80 32 50 50 40…
A: 32 40 44 50 50 50 57 57 60 61 62 67 69 70 70 73 76 80 81 90
Q: Find the range and interquartile range of the data represented by the box-and-whisker plot. 01 3 6.…
A: As per the given box and whisker plot, we have: The maximum data value 8 and the minimum data value…
Q: A baseball is thrown upward, and its height measured at 0.5-second intervals using a strobe light.…
A: Given data is Time (s) Height (feet) 0 4.2 0.5 26.1 1.0 40.1 1.5 46.0 2.0 43.9 2.5…
Q: 1 4 6. E (J) 1.99*10^6 6.3*10^7 1.99*10^9 6.3*10^10 1.99*10^12 6.3*10^13 1.99*10^15 5. In a…
A: The given data is: M E(J) E(J) 1 1.99*10^6 1990000 2 6.3*10^7 63000000 3 1.99*10^9 1.99E+09…
Q: Here is a data set: 63 55 69 64 86 52 57 58 69 81 63 61 59 || 64 69 66| 66 | 59 || 60 || 75 59 67 60…
A: To complete the given stem-and-leaf-plot As shown below;
Q: The box-and-whisker plots below show the scores earned by 6th and 7th graders on a year-end reading…
A: The scores earned by 6th and 7th graders on a year ending reading test is shown through the box and…
Q: Here is a data set: 45 52 62 51 52 55 50 54 52 44 65 51 49 51 57 45 49 46 47 50 74 74 54 42 57 63 51…
A: Given that The data are…
Q: (a) Find the five-number summary, and (b) draw a box-and-whisker plot of the data. 3886298 79…
A: Given data set3,8,8,6,2,9,8,7,9,6,9,4,2,6,2,9,8,7,7,9
Q: (a) Find the five-number summary, and (b) draw a box-and-whisker plot of the data. 48852987959425 29…
A: Introduction: The five-number summary includes the minimum, first quartile, second quartile…
Q: MAFS.912. S-ID.1.1 Yesenia records the ages of 9 friends. A box plot of her data set is shown.…
A: For Dot Plot first you have to know in this question how to recognise in which age group Yesenia…
Q: Residents in a city are charged for water usage every three months. The water bill is computed from…
A:
Q: The data represents the heights of eruptions by a geyser. Use the heights to construct a stemplot.…
A: Given data of heights of eruptions by a geyser given in inches61 32 50 90 80 50 40 70 50 61 73 56 59…
Q: The data show the number of hours spent studying per day by a sample of 28 students. Use the…
A: We have given box and whisker plot
Q: (a) Find the five-number summary, and (b) draw a box-and-whisker plot of the data.…
A: Given data is3,8,8,5,2,9,8,7,9,6,9,4,1,6,2,9,8,7,7,9n = 20
Q: The data represents the heights of eruptions by a geyser. Height of eruption (in.) 900 67 33 50 Use…
A: We have given that data First i want to make stemand leaf plot.
Q: (a) Find the five-number summary, and (b) draw a box-and-whisker plot of the data 388429 8 69 49…
A: Introduction: The five-number summary includes the minimum, first quartile, second quartile…
Q: (a) Find the five-number summary, and (b) draw a box-and-whisker plot of the data. 388629 879 69 5…
A:
Q: You are examining the data with a stem-and-leaf plot. Here is the start of the plot. Finish the…
A: Here it is asked to find leaf for the given stem is equal to 7. First step is to arrange the data…
Q: Next question (a) Find the five-number summary, and ) draw a box and whaker plot of he data work…
A:
Q: a) Find the five-number summary, and (b) draw a box-and-whisker plot of the data. 388529 879 59 4 2…
A: (a) The data in the ascending order is 2, 2, 2, 3, 4, 5, 5, 6, 7, 7, 7, 8, 8, 8, 8, 9, 9, 9, 9, and…
Q: The data to the right shows the number of graduating students with business majors at a university…
A: option C
Q: 8 The box plot describes the peaches harvested from trees in an orchard. Peach Harvest 85 100 115…
A:
Q: (a) Find the five-number summary, and (b) draw a box-and-whisker plot of the data. 48852987959 4 25…
A: The given data is 4, 8, 8, 5, 2, 9, 8, 7, 9, 5, 9, 4, 2, 5, 2, 9, 8, 7, 7, and 9.
Q: Here is a data set: 33 67 53 42 31 67 41 47 41 42 44 45 34 49 64 30 48 41 51 34 46 39 53…
A: The stem and leaf plot for the data is obtained from MINITAB software and given below.
Q: (a) Find the five-number summary, and (b) draw a box-and-whisker plot of the data. 48852987 9 5 9 4…
A: The given dataset is: 4 8 8 5 2 9 8 7 9 5 9 4 2 5 2 9 8 7 7…
Q: use the stem-and-leaf plot at the right th ne costs of various DVD players at an electronics store.…
A: 5. Given is the stem and leaf plot, where the first column shows the data points' initial digits,…
Q: (a) Find the five-number summary, and (b) draw a 3 8 8 6 2 9 8 7 9 6 9 3 2 6 2 9 8 7 79 (a) Min =…
A:
Q: The data in Table Q4 shows the results of the analysis on the effect of compressive strength to the…
A: Solution: The independent variable is Compressive strenth. The dependent variable is Density.
Q: Here is a data set: 49 47 33 40 57 30 55 31 37 39 68 40 46 39 48 68 64 40 49 59 49 41 36 55 46 31 58…
A: stem and leaf plot used to display quantitative data in graphical format like histogram given data…
Q: Construct a box plot from the given data. Use the approximation method. Diameters of Cans in an…
A:


Trending now
This is a popular solution!

Step by step
Solved in 3 steps with 4 images


- 2. A researcher measures the relationship between education (in years) and investment gains (in thousands of dollars). Answer the following questions based on the results provided. SP = 16.25.a. Create a scatter plot of the datab. Calculate r and r2c. Report results in APA style.d. What do results meanWhich value of r would be appropriate for the scatter plot shown? 1. 0.4 2. 0.0 3. -0.4 4. 0.9Mars, Inc. states that 16% of all milk chocolate M&M’S® produced are green. A group of students took the following samples from a bowl of 500 mixed up M&M’S®. (see attached) What information do we need in order to answer our question or investigate the claim that 16% of milk chocolate M&M’S® produced by Mars, Inc. are green? How can we use the samples of M&M’S® to obtain this information? What value is at the center of the dot plot constructed by using one sample per group? Is it a coincidence that the value is close to/far from the 16% claimed by Mars, Incorporated? Mars, Inc. claimed that 16% of milk chocolate M&M’S® produced are green. Does the information on the dot plot seem to support this claim? Why or why not?
- A researcher measures the relationship between education (in years) and investment gains (in thousands of dollars). Answer the following questions based on the results provided. SP = 16.25. a. Create a scatter plot of the data & Calculate r and r2b. Report results in APA style & What do results mean? Education Investment Gains 14 8 12 11 9 10 18 14A used car company believes that there is a relationship between the amount spent on advertising and its sales. Data collected for 6 years are as follow: Amount spent on advertising Sales ($thousands) ($millions) 2.0 1 3.0 3 2.5 4 2.0 2 2.0 1 3.5 7 1. Illustrate the above on a scatter plot.The power of the slope t-test is NOT determined by: A)direction of slope B) sample size C) effect size D) alpha
- 6) part 4. Generate a abo plot for the asteroid data.My data-price column 3850 3999 5289 5800 5995 6495 6823 6897 6980 6999 6999 7500 7995 8199 8883 8989 8995 9000 9800 9991 10999 11999 12212 12900 13490 14499 15849 17500 18723 20990 Using the price column, recall your box plot from Part 2 and compute the 5 number summary of your data. Find the z score that corresponds to the first quartile. What probability corresponds to this z score? Find the z score that corresponds to the third quartile. What probability corresponds to this z score? In your own words (using complete sentences) describe why these probabilities make sense. (Hint: How do the box plot and the z table relate to one another?)Please help me solve this practice question, # of vacation days 5 3 9 2 50 22 7 3 2 2 6 4 0 15 0 15 0 3 20 8 6 5 0 0 1 1 H) Construct the box-and- whisker plot that represents the data. Format it and display the data label (Q1, Q2, Q3, …. ) on the boxplot I) Comment on the shape of the distribution(symmetric, left-skewed, right-skewed)
- Is the magnitude of an earthquake related to the depth below the surface at which the quake occurs? Let x be the magnitude of an earthquake (on the Richter scale), and let y be the depth (in kilometers) of the quake below the surface at the epicenter. x 3.1 4.3 3.3 4.5 2.6 3.2 3.4 y 4.8 9.6 11.2 10.0 7.9 3.9 5.5 A) Make a scatter diagram of the data. Use a calculator to verify that Σx = 24.4, Σx2 = 87.80, Σy = 52.9, Σy2 = 448.51 and Σxy = 189.84.B) Compute r. (Round to 3 decimal places.) C) As x increases, does the value of r imply that y should tend to increase or decrease? Explain your answer.A study is made of the relationship between annual production volume of Good A and factory floor area. Table below shows the data from a sample of 10 factories. Factory Factory floor area, X (‘000m2 ) Annual production volume, Y ($‘ 000) 1 40 3.5 2 600 25.0 3 60 4.8 4 72 3.5 5 400 30.0 6 90 5.0 7 200 12.0 8 70 4.5 9 80 5.0 10 84 6.0 Construct a scatter plot.One factor in the development of tennis elbow, a malady that strikes fear in the hearts of all serious tennis players, is the impact-induced vibration of the racket-and-arm system at ball contact. It is well known that the likelihood of getting tennis elbow depends on various properties of the racket used. Consider the scatter plot of x = racket resonance frequency (Hz) and y = sum of peak-to-peak acceleration (a characteristic of arm vibration, in m/sec/sec) for n = 23 different rackets.† Discuss interesting features of the data and scatter plot.

