A firm experienced the demand shown in the following table. Fill in the table by preparing forecasts based on a five-year moving average, a three-year moving average, and exponential smoothing (w = 0.9 and w = 0.3 ). (Note: The exponential smoothing forecasts may be begun by assuming Yt+ F Y; •)
A firm experienced the demand shown in the following table. Fill in the table by preparing forecasts based on a five-year moving average, a three-year moving average, and exponential smoothing (w = 0.9 and w = 0.3 ). (Note: The exponential smoothing forecasts may be begun by assuming Yt+ F Y; •)

Managerial Economics: Applications, Strategies and Tactics (MindTap Course List)
14th Edition
ISBN:9781305506381
Author:James R. McGuigan, R. Charles Moyer, Frederick H.deB. Harris
Publisher:James R. McGuigan, R. Charles Moyer, Frederick H.deB. Harris
Chapter5: Business And Economic Forecasting
Section: Chapter Questions
Problem 5E: A firm experienced the demand shown in the following table. *Unkown future value to be forecast Fill...

Related questions
Question
100%
Transcribed Image Text:5. Exercise 5.5
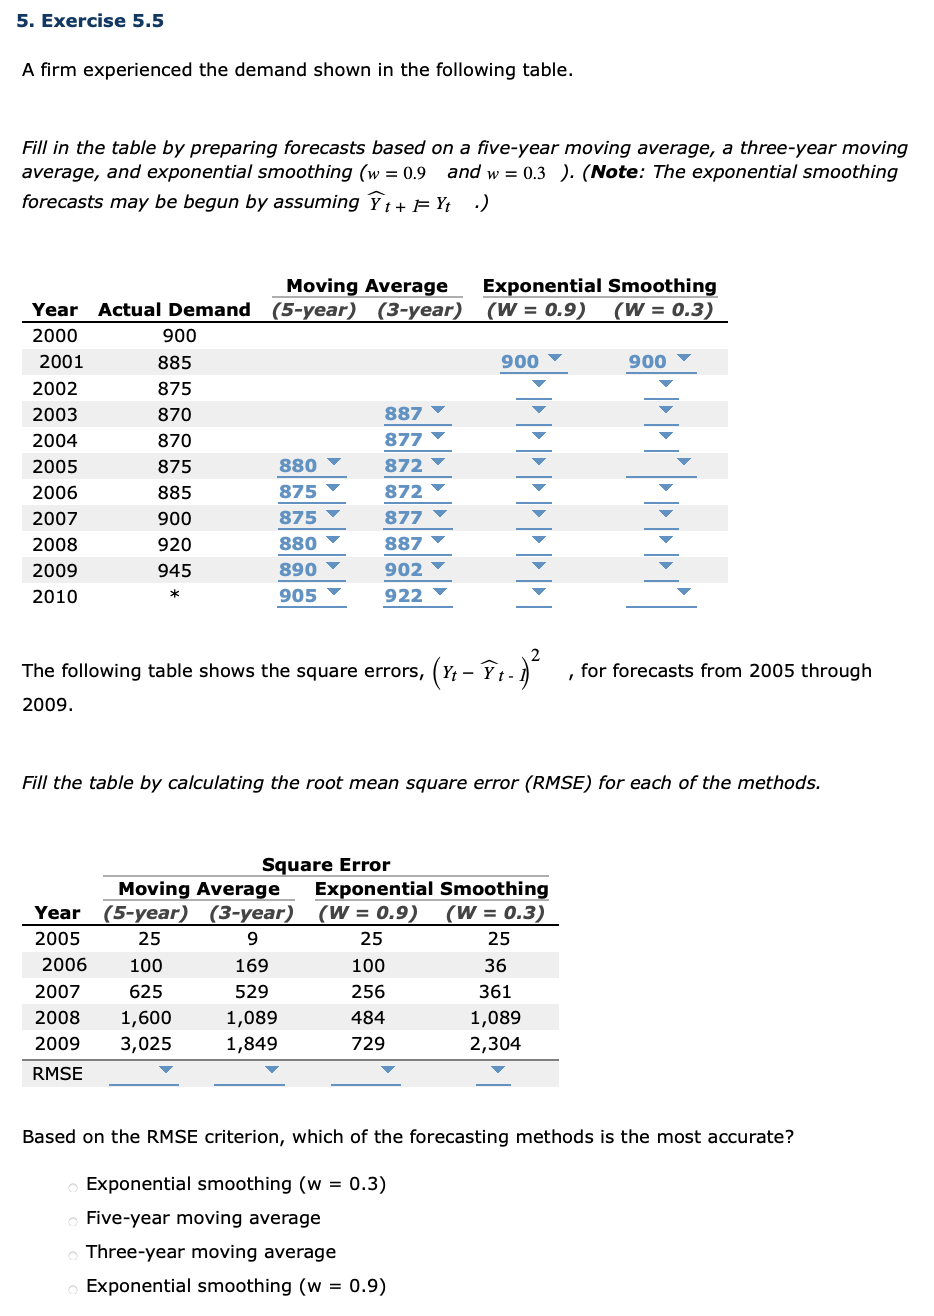
A firm experienced the demand shown in the following table.
Fill in the table by preparing forecasts based on a five-year moving average, a three-year moving
average, and exponential smoothing (w = 0.9
forecasts may be begun by assuming Y t+ F Yt •)
and w = 0.3 ). (Note: The exponential smoothing
Moving Average
Actual Demand (5-year) (3-year)
Exponential Smoothing
(W = 0.9)
Year
(W = 0.3)
2000
900
2001
885
900
900
2002
875
2003
870
887 ▼
2004
870
877 ▼
2005
875
880
872 Y
2006
885
875
872
2007
900
875
877
2008
920
880
887 -
2009
945
890
902 Y
2010
905
922
The following table shows the square errors,
(Y; - T1-) , for forecasts from 2005 through
2009.
Fill the table by calculating the root mean square error (RMSE) for each of the methods.
Square Error
Exponential Smoothing
Moving Average
Year (5-year) (3-year) (W = 0.9)
(W = 0.3)
2005
25
9
25
25
2006
100
169
100
36
2007
625
529
256
361
2008
1,600
1,089
484
1,089
2009
3,025
1,849
729
2,304
RMSE
Based on the RMSE criterion, which of the forecasting methods is the most accurate?
Exponential smoothing (w = 0.3)
Five-year moving average
Three-year moving average
Exponential smoothing (w = 0.9)
Expert Solution
This question has been solved!
Explore an expertly crafted, step-by-step solution for a thorough understanding of key concepts.

This is a popular solution!

Trending now
This is a popular solution!

Step by step
Solved in 2 steps with 1 images

Knowledge Booster


Learn more about
Need a deep-dive on the concept behind this application? Look no further. Learn more about this topic, economics and related others by exploring similar questions and additional content below.Recommended textbooks for you
Managerial Economics: Applications, Strategies an…
Economics
ISBN:
9781305506381
Author:
James R. McGuigan, R. Charles Moyer, Frederick H.deB. Harris
Publisher:
Cengage Learning


Managerial Economics: Applications, Strategies an…
Economics
ISBN:
9781305506381
Author:
James R. McGuigan, R. Charles Moyer, Frederick H.deB. Harris
Publisher:
Cengage Learning