Part C 3. The manager of a certain gasoline station wants to forecast the demand for the unleaded gasoline next month so that the proper number of gallons can be ordered from the distributor. The manager has accumulated the following data demand for unleaded gasoline from sales during the past eight months. Month Gasoline Demanded (gallons) Mar 900 Given that the forecast for March is 920. Аpr 755 May 650 Jun 550 Jul 625 Aug 730 Sept 820 Oct 1100 a. Compute the exponential smoothed forecast for the demand from April to November. Use a = 0.25. b. Compute the exponential smoothed forecast for the demand from April to November. Use a = 0.45. c. Plot the actual demand and the forecasts determined in part a and b on the same graph and compare them. d. Make a comparative analysis out of your answers in the plotted data. (3-5 sentences)
Part C 3. The manager of a certain gasoline station wants to forecast the demand for the unleaded gasoline next month so that the proper number of gallons can be ordered from the distributor. The manager has accumulated the following data demand for unleaded gasoline from sales during the past eight months. Month Gasoline Demanded (gallons) Mar 900 Given that the forecast for March is 920. Аpr 755 May 650 Jun 550 Jul 625 Aug 730 Sept 820 Oct 1100 a. Compute the exponential smoothed forecast for the demand from April to November. Use a = 0.25. b. Compute the exponential smoothed forecast for the demand from April to November. Use a = 0.45. c. Plot the actual demand and the forecasts determined in part a and b on the same graph and compare them. d. Make a comparative analysis out of your answers in the plotted data. (3-5 sentences)

Managerial Economics: Applications, Strategies and Tactics (MindTap Course List)
14th Edition
ISBN:9781305506381
Author:James R. McGuigan, R. Charles Moyer, Frederick H.deB. Harris
Publisher:James R. McGuigan, R. Charles Moyer, Frederick H.deB. Harris
Chapter3: Demand Analysis
Section: Chapter Questions
Problem 8E: The Stopdecay Company sells an electric toothbrush for $25. Its sales have averaged 8,000 units per...

Related questions
Question
100%
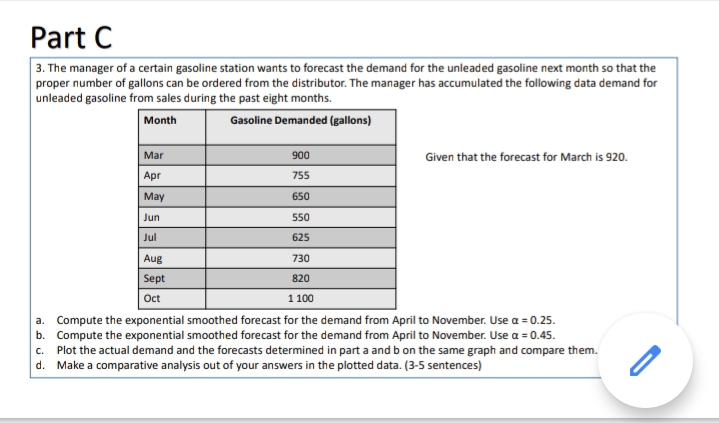
Transcribed Image Text:Part C
3. The manager of a certain gasoline station wants to forecast the demand for the unleaded gasoline next month so that the
proper number of gallons can be ordered from the distributor. The manager has accumulated the following data demand for
unleaded gasoline from sales during the past eight months.
Month
Gasoline Demanded (gallons)
Mar
900
Given that the forecast for March is 920.
Apr
755
May
650
Jun
550
Jul
625
Aug
730
Sept
820
Oct
1 100
a. Compute the exponential smoothed forecast for the demand from April to November. Use a = 0.25.
b. Compute the exponential smoothed forecast for the demand from April to November. Use a = 0.45.
c. Plot the actual demand and the forecasts determined in part a and b on the same graph and compare them.
d. Make a comparative analysis out of your answers in the plotted data. (3-5 sentences)
Expert Solution
This question has been solved!
Explore an expertly crafted, step-by-step solution for a thorough understanding of key concepts.

Step by step
Solved in 4 steps with 1 images

Recommended textbooks for you
Managerial Economics: Applications, Strategies an…
Economics
ISBN:
9781305506381
Author:
James R. McGuigan, R. Charles Moyer, Frederick H.deB. Harris
Publisher:
Cengage Learning

Essentials of Economics (MindTap Course List)
Economics
ISBN:
9781337091992
Author:
N. Gregory Mankiw
Publisher:
Cengage Learning

Principles of Economics 2e
Economics
ISBN:
9781947172364
Author:
Steven A. Greenlaw; David Shapiro
Publisher:
OpenStax
Managerial Economics: Applications, Strategies an…
Economics
ISBN:
9781305506381
Author:
James R. McGuigan, R. Charles Moyer, Frederick H.deB. Harris
Publisher:
Cengage Learning
Essentials of Economics (MindTap Course List)
Economics
ISBN:
9781337091992
Author:
N. Gregory Mankiw
Publisher:
Cengage Learning
Principles of Economics 2e
Economics
ISBN:
9781947172364
Author:
Steven A. Greenlaw; David Shapiro
Publisher:
OpenStax


