
Videos
A firm experienced the demand shown in the following table.
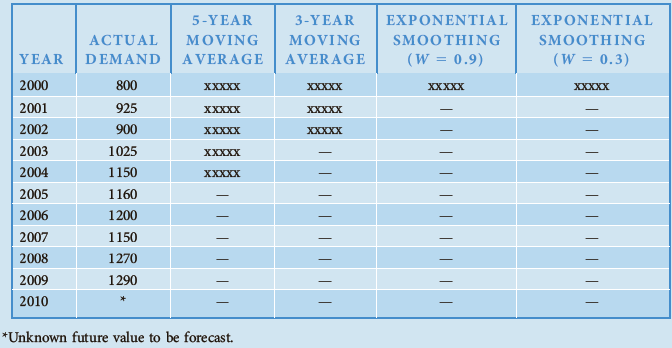
*Unkown future value to be forecast
- Fill in the table by preparing forecasts based on a five-year moving average, a three-year moving average, and exponential smoothing (with a
-
- Using the forecasts from 2005 through 2009, compare the accuracy of each of the
forecasting methods based on the RMSE criterion. - Which forecast would you have used for 2010? Why?
a)
To complete: The missing values in the table.
Explanation of Solution
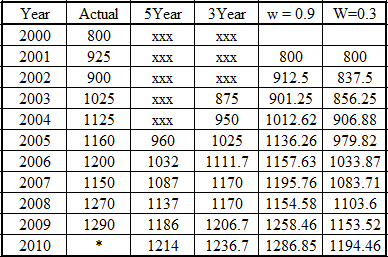
To fill 5th year column. Use below formula.
Similarly, for 3year column.
For exponential smoothing:
Let the value forecasted value for 2000 is zero and assume the forecast value of 2001 is 800.
b)
To compare: The accuracy of forecast methods.
Explanation of Solution
Root mean square error is used to find the accuracy.
| Year | Actual value (Yt) | Forecast ( | ||
| 2005 | 1160 | 960 | 200 | 40000 |
| 2006 | 1200 | 1032 | 168 | 28224 |
| 2007 | 1150 | 1087 | 63 | 3969 |
| 2008 | 1270 | 1137 | 133 | 17689 |
| 2009 | 1290 | 1186 | 104 | 10816 |
Now calculate the RMSE.
Now calculate the RMSE for 3 year moving average.
| Year | Actual value (Yt) | Forecast ( | ||
| 2005 | 1160 | 1025 | 135 | 18225 |
| 2006 | 1200 | 1112 | 88 | 7744 |
| 2007 | 1150 | 1170 | -20 | 400 |
| 2008 | 1270 | 1170 | 100 | 10000 |
| 2009 | 1290 | 1207 | 83 | 6889 |
Calculate RMSE.
Now calculate the RMSE when w = 0.9
| Year | Actual value (Yt) | Forecast ( | ||
| 2005 | 1160 | 1136.26 | 23.74 | 563.5876 |
| 2006 | 1200 | 1157.63 | 42.37 | 1795.217 |
| 2007 | 1150 | 1195.76 | -45.76 | 2093.978 |
| 2008 | 1270 | 1154.58 | 115.42 | 13321.78 |
| 2009 | 1290 | 1258.46 | 31.54 | 994.7716 |
Now calculate the RMSE when w = 0.3
| Year | Actual value (Yt) | Forecast ( | ||
| 2005 | 1160 | 979.82 | 180.18 | 32464.83 |
| 2006 | 1200 | 1033.87 | 166.13 | 27599.18 |
| 2007 | 1150 | 1083.71 | 66.29 | 4394.364 |
| 2008 | 1270 | 1103.71 | 166.4 | 27688.96 |
| 2009 | 1290 | 1153.52 | 136.48 | 18626.79 |
Conclusion: The lowest value of RMSE reflects the greater accuracy. Therefore, when w = 0.9 then RMSE shows most accurate model.
c)
To Find: The method used to forecast.
Explanation of Solution
Since the greater accuracy come for the exponential smoothening with w = 0.9. Thus, same will be used to forecast the demand of 2010.
Want to see more full solutions like this?
Chapter 5 Solutions
Managerial Economics: Applications, Strategies and Tactics (MindTap Course List)


- The forecasting staff for the Prizer Corporation has developed a model to predict sales of its air-cushioned-ride snowmobiles. The model specifies that sales S vary jointly with disposable personal income Y and the population between ages 15 and 40, Z, and inversely with the price of the snowmobiles P. Based on past data, the best estimate of this relationship is S=kYZP where k has been estimated (with past data) to equal 100. If Y=11,000,Z=1,200, and P=20,000, what value would you predict for S? What happens if P is reduced to $17,500? How would you go about developing a value for k? What are the potential weaknesses of this model?arrow_forwardEstimate the double-log (log linear) time trend model for log cruise ship arrivals against log time. Estimate a linear time trend model of cruise ship arrivals against time. Calculate the root mean square error between the predicted and actual value of cruise ship arrivals. Is the root mean square error greater for the double log non-linear time trend model or for the linear time trend model?arrow_forwardSavings-Mart (a chain of discount department stores) sells patio and lawn furniture. Sales are seasonal, with higher sales during the spring and summer quarters and lower sales during the fall and winter quarters. The company developed the following quarterly sales forecasting model: Y t=8.25+0.125t2.75D1t+3.50D3t where Y t=predictedsales(million)inquartert 8.25=quarterlysales(million)whent=0 t=timeperiod(quarter)wherethefourthquarterof2002=0,firstquarterof2003=1,secondquarterof2003=2,... D1t={1forfirst-quarterobservations0otherwiseD2t={1forsecond-quarterobservations0otherwiseD3t={1forthird-quarterobservations0otherwise Forecast Savings-Marts sales of patio and lawn furniture for each quarter of 2010.arrow_forward
- Metropolitan Hospital has estimated its average monthly bed needs as N=1,000+9X where X=timeperiod(months);January2002=0 N=monthlybedneeds Assume that no new hospital additions are expected in the area in the foreseeable future. The following monthly seasonal adjustment factors have been estimated, using data from the past five years: Forecast Metropolitans bed demand for January, April, July, November, and December 2007. If the following actual and forecast values for June bed demands have been recorded, what seasonal adjustment factor would you recommend be used in making future June forecasts?arrow_forwardBell Greenhouses has estimated its monthly demand for potting soil to be the following: N=400+4X where N=monthlydemandforbagsofpottingsoil X=timeperiodsinmonths(March2006=0) Assume this trend factor is expected to remain stable in the foreseeable future. The following table contains the monthly seasonal adjustment factors, which have been estimated using actual sales data from the past five years: Forecast Bell Greenhouses demand for potting soil in March, June, August, and December 2007. If the following table shows the forecasted and actual potting soil sales by Bell Greenhouses for April in five different years, determine the seasonal adjustment factor to be used in making an April 2008 forecast.arrow_forwardHistorical demand for Peeps is as displayed in the table. Month Demand January 11 February 18 March 31 April 39 May 44 June 53 July 67 August 82 September 96 Develop forecasts from June through October using these techniques: Holt's method with alpha=0.2 and beta=0.1. For Holt's model, the level and trend for May are assumed to be 44 and 12. Judge which forecast method is the best based on MAD.arrow_forward
- Choose one of the following forecasting methods discussed in this chapter: last-value, averaging, moving-average, or exponential smoothing. Identify the conditions when the method is most appropriate to use and give an example of an application of this method.arrow_forwardComprehensively state the criteria and process of selecting appropriate models for time series forecasting.arrow_forwardA local moving company has collected data on the number of moves they have been asked to perform over the past two years. Moving is highly seasonal, so the owner/operator, who is both burly and highly educated, decides to apply the multiplicative seasonal method to forecast the number of customers for the coming year. The equation for the trend line of yearly sales is Ft = 16 + 60t. Please forecast demand for each quarter in Year 3. (Round the forecasts to whole numbers and show all calculations). Complete the table below and forecast the sales of Year 3 by quarter. Year 1 Year 2 Year 3 Quarter Demand Seasonal Index Quarter Demand Seasonal Index Average Seasonal Index Forecast 1 20 1 27 2 40 2 45 3 45 3 55 4 31 4 41 Total Averagearrow_forward
- Suppose that you work for a U.S. senator who is contemplating writing a bill that would put a national sales tax in place. Because the tax would be levied on the sales revenue of retail stores, the senator has asked you to prepare a forecast of retail store sales for year 8, based on data from year 1 through year 7. The data are: (c1p2) Year Retail Store Sales 1 $1,225 2 1,285 3 1,359 4 1,392 5 1,443 6 1,474 7 1,467 54 Chapter One a. Use the first naive forecasting model presented in this chapter to prepare a forecast of retail store sales for each year from 2 through 8. b. Prepare a time-series graph of the actual and forecast values of retail store sales for the entire period. (You will not have a forecast for year 1 or an actual value for year 8.) c. Calculate the root-mean-squared error for your forecast series using the values for year 2 through year 7. 3. Use the second naive forecasting model presented in this chapter to answer parts (a) through (c) of Exercise 2. Use P 0.2 in…arrow_forwardIdentify and briefly describe the two general forecasting approaches.arrow_forwardIs it true of false that the classical errors in variables (CEV) assumption is that the measurement error is correlated with the unobserved true value of the explanatory variable.arrow_forward
 Managerial Economics: Applications, Strategies an...EconomicsISBN:9781305506381Author:James R. McGuigan, R. Charles Moyer, Frederick H.deB. HarrisPublisher:Cengage Learning