
Videos
Bell Greenhouses has estimated its monthly
where
Assume this trend factor is expected to remain stable in the foreseeable future. The following table contains the monthly seasonal adjustment factors, which have been estimated using actual sales data from the past five years:
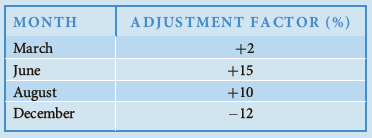
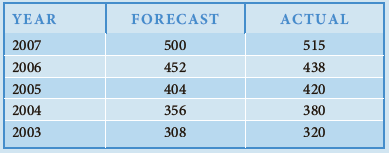
Forecast Bell Greenhouses’ demand for potting soil in March, June, August, and December 2007.- If the following table shows the forecasted and actual potting soil sales by Bell Greenhouses for April in five different years, determine the seasonal adjustment factor to be used in making an April 2008 forecast.

Trending nowThis is a popular solution!

Chapter 5 Solutions
Managerial Economics: Applications, Strategies and Tactics (MindTap Course List)


- Metropolitan Hospital has estimated its average monthly bed needs as N=1,000+9X where X=timeperiod(months);January2002=0 N=monthlybedneeds Assume that no new hospital additions are expected in the area in the foreseeable future. The following monthly seasonal adjustment factors have been estimated, using data from the past five years: Forecast Metropolitans bed demand for January, April, July, November, and December 2007. If the following actual and forecast values for June bed demands have been recorded, what seasonal adjustment factor would you recommend be used in making future June forecasts?arrow_forwardWorldwide annual sales of a device in 2012–2013 were approximately q = −6p + 3,040 million units at a selling price of $p per unit. Assume a manufacturing cost of $40 per unit. [HINT: Recall that Profit = Revenue − Cost.] Find the function P for annual profit, in millions of dollars and in terms of p only, subject to any constraints. P(p) = ____ Find P′(p). P′(p) = ____ What selling price (in dollars) would have resulted in the largest annual profit? (Round your answer to two decimal places.) p = $____ What would have been the resulting annual profit (in millions of dollars)? (Round your answer to the nearest whole number.) $ ____ millionarrow_forwardThe demand function for Newton’s Donuts has been estimated as follows:Qx = -14 – 54Px + 45Py + 0.62Ax where Qx represents thousands of donuts; Px is the price per donut; Py is the average price per donut of other brands of donuts; and Ax represents thousands of dollars spent on advertising Newton’s Donuts. The current values of the independent variables are Ax=120, Px=0.95, and Py=0.64.Show all of your calculations and processes. Describe your answer for each question in complete sentences, whenever it is necessary. Calculate the price elasticity of demand for Newton’s Donuts and describe what it means. Describe your answer and show your calculations. Derive an expression for the inverse demand curve for Newton’s Donuts. Describe your answer and show your calculations. If the cost of producing Newton’s Donuts is constant at $0.15 per donut, should they reduce the price and thereafter, sell more donuts (assuming profit maximization is the company’s goal)? Should Newton’s Donuts spend…arrow_forward
- Manning Inc. is the leading manufacturer of garage doors. Demand for residential garage doors depends, of course, on the rate at which new houses are being built, which in turn depends on changes in income per capita. During the past year, Manning sold 10 000 garage doors at an average price of R1 500 per door. In the coming year, disposable income per capita is expected to increase from R32 000 to R34 000. Without any price change, Manning expects current-year sales to rise to 12 000 units. 1. Calculate the arc income elasticity of demand. 2. The company economist estimates that in conjunction with the change in income, if the price of doors is increased by R100, they could sell 11 500 doors. What is the arc price elasticity and what would be the company’s revenue? 3. Should they raise the price even more?arrow_forwardThe demand function for a product is given by P = 4000/ln (x+10), where P is the price per unit in dollars when x units are demanded.i. Find the rate of change of price with respect to the number of units sold when 40 units are sold ii. Find the rate of change of price with respect to the number of units sold when 90 units are sold.iii. Find the second derivative to see whether the rate at which the price is changing at 40 units is increasing or decreasing.arrow_forward21. Consider a firm subject to quarter-to-quarter variation in its sales. Suppose that the following equation was estimated using quarterly data for the period 2011–2018 (the time variable goes from 1 to 32). The variables D1, D2, and D3 are, respectively, dummy variables for the first, second, and third quarters (e.g., D1 is equal to 1 in the first quarter and 0 otherwise). Qt =a+bt+c1D1+c2D2+c3D3 The results of the estimation are presented here: a. Calculate the intercept in each of the four quarters. What do these values imply? b. Use this estimated equation to forecast sales in the fourth quarter of 2019.arrow_forward
- Maha industries produces a product whose anticipated demand for the six periods is 263,256,301, , and the firm has adopted level production strategy with a constant production of 280 units per period. The regular production cost is RO 12 per unit, whereas the overtime and subcontract costs are RO 20 and RO 25 per unit respectively. There is no limit on subcontracting however, maximum overtime production capacity is 10. Average Inventory holding cost RO 5 per unit per period. What will be inventory level at the end of period 3?arrow_forwardSavings-Mart (a chain of discount department stores) sells patio and lawn furniture. Sales are seasonal, with higher sales during the spring and summer quarters and lower sales during the fall and winter quarters. The company developed the following quarterly sales forecasting model: Y t=8.25+0.125t2.75D1t+3.50D3t where Y t=predictedsales(million)inquartert 8.25=quarterlysales(million)whent=0 t=timeperiod(quarter)wherethefourthquarterof2002=0,firstquarterof2003=1,secondquarterof2003=2,... D1t={1forfirst-quarterobservations0otherwiseD2t={1forsecond-quarterobservations0otherwiseD3t={1forthird-quarterobservations0otherwise Forecast Savings-Marts sales of patio and lawn furniture for each quarter of 2010.arrow_forwardEstimate the double-log (log linear) time trend model for log cruise ship arrivals against log time. Estimate a linear time trend model of cruise ship arrivals against time. Calculate the root mean square error between the predicted and actual value of cruise ship arrivals. Is the root mean square error greater for the double log non-linear time trend model or for the linear time trend model?arrow_forward
- The economic analysis division of Mapco Enterprises has estimated the demand function for its line of weed trimmers as QD=18,000+0.4N350PM+90Ps where N=numberofnewhomescompletedintheprimarymarketarea PM=priceoftheMapcotrimmerPS=priceofitscompetitorsSurefiretrimmer In 2010, 15,000 new homes are expected to be completed in the primary market area. Mapco plans to charge $50 for its trimmer. The Surefire trimmer is expected to sell for $55. What sales are forecasted for 2010 under these conditions? If its competitor cuts the price of the Surefire trimmer to $50, what effect will this have on Mapcos sales? What effect would a 30 percent reduction in the number of new homes completed have on Mapcos sales (ignore the impact of the price cut of the Surefire trimmer)?arrow_forwardThe forecasting staff for the Prizer Corporation has developed a model to predict sales of its air-cushioned-ride snowmobiles. The model specifies that sales S vary jointly with disposable personal income Y and the population between ages 15 and 40, Z, and inversely with the price of the snowmobiles P. Based on past data, the best estimate of this relationship is S=kYZP where k has been estimated (with past data) to equal 100. If Y=11,000,Z=1,200, and P=20,000, what value would you predict for S? What happens if P is reduced to $17,500? How would you go about developing a value for k? What are the potential weaknesses of this model?arrow_forwardA manufacturer of entertainment centers uses the completion of new homes as part of their demand forecast. They consider that for every five homes that cost over $300,000 in the city, they make one sale. For every 20 new homes that cost over $150,000 but less than $300,000 in the city, they make one sale. Their projected demand for the future period, before they consider home sales, is for six entertainment centers. They now receive home figures of ten new homes of over $300,000 and 40 new homes of $150,000-$300,000. What should their new forecast be?arrow_forward
 Managerial Economics: Applications, Strategies an...EconomicsISBN:9781305506381Author:James R. McGuigan, R. Charles Moyer, Frederick H.deB. HarrisPublisher:Cengage Learning