A frequency distribution is shown below. Complete parts (a) and (b). The number of televisions per household in a small town Televisions 0 Households. 24 2 722 (a) Use the frequency distribution to construct a probability distribution. P(x) OA. X 0 1 2 3 (Round to three decimal places as needed.) (b) Graph the probability distribution using a histogram. Choose the correct graph of the distribution below. AP(X) 1 443 0.6- 0.5- 0.4- 0.3- 0.2 0.1- 0 1 2 3 x # of Televisions 3 1402 Q G Describe the histogram's shape. Choose the correct answer below. O B. AP(X) 0.6 0.5- 0.4- 0.3- 0.2 0.1- 0 1 2 3 # of Televisions Q 2 O C. AP(x) 0.6 0.5- 0.4- 0.3- 0.2- 0.1 # of Televisions Q
A frequency distribution is shown below. Complete parts (a) and (b). The number of televisions per household in a small town Televisions 0 Households. 24 2 722 (a) Use the frequency distribution to construct a probability distribution. P(x) OA. X 0 1 2 3 (Round to three decimal places as needed.) (b) Graph the probability distribution using a histogram. Choose the correct graph of the distribution below. AP(X) 1 443 0.6- 0.5- 0.4- 0.3- 0.2 0.1- 0 1 2 3 x # of Televisions 3 1402 Q G Describe the histogram's shape. Choose the correct answer below. O B. AP(X) 0.6 0.5- 0.4- 0.3- 0.2 0.1- 0 1 2 3 # of Televisions Q 2 O C. AP(x) 0.6 0.5- 0.4- 0.3- 0.2- 0.1 # of Televisions Q

Chapter8: Sequences, Series,and Probability
Section8.7: Probability
Problem 35E: Unemployment In 2015, there were approximately 8.3 million unemployed workers in the United States....

Related questions
Question
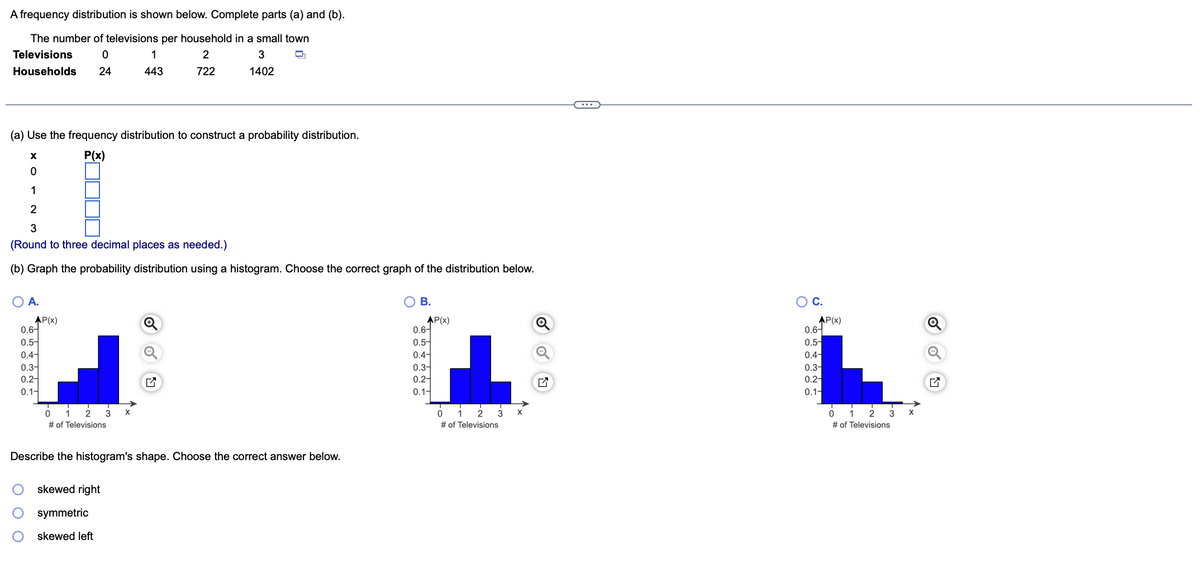
Transcribed Image Text:A frequency distribution is shown below. Complete parts (a) and (b).
The number of televisions per household in a small town
Televisions 0
3
2
722
Households 24
1402
(a) Use the frequency distribution to construct a probability distribution.
P(x)
X
0
1
2
3
(Round to three decimal places as needed.)
(b) Graph the probability distribution using a histogram. Choose the correct graph of the distribution below.
A.
AP(x)
0.6-
0.5-
0.4-
0.3-
0.2-
0.1-
0
2
# of Televisions
1
443
X
skewed right
symmetric
skewed left
Describe the histogram's shape. Choose the correct answer below.
B.
AP(x)
0.6-
0.5-
0.4
0.3-
0.2-
0.1-
0
1 2
# of Televisions
X
O
C.
AP(x)
0.6
0.5-
0.4-
0.3-
0.2-
0.1-
0
1 2
# of Televisions
X
Expert Solution
This question has been solved!
Explore an expertly crafted, step-by-step solution for a thorough understanding of key concepts.

This is a popular solution!

Trending now
This is a popular solution!

Step by step
Solved in 4 steps with 6 images

Recommended textbooks for you

College Algebra
Algebra
ISBN:
9781305115545
Author:
James Stewart, Lothar Redlin, Saleem Watson
Publisher:
Cengage Learning

Algebra and Trigonometry (MindTap Course List)
Algebra
ISBN:
9781305071742
Author:
James Stewart, Lothar Redlin, Saleem Watson
Publisher:
Cengage Learning
College Algebra
Algebra
ISBN:
9781305115545
Author:
James Stewart, Lothar Redlin, Saleem Watson
Publisher:
Cengage Learning
Algebra and Trigonometry (MindTap Course List)
Algebra
ISBN:
9781305071742
Author:
James Stewart, Lothar Redlin, Saleem Watson
Publisher:
Cengage Learning

Algebra & Trigonometry with Analytic Geometry
Algebra
ISBN:
9781133382119
Author:
Swokowski
Publisher:
Cengage