
MATLAB: An Introduction with Applications
6th Edition
ISBN: 9781119256830
Author: Amos Gilat
Publisher: John Wiley & Sons Inc
expand_more
expand_more
format_list_bulleted
Related questions
Question
Correctly write the hypothesis statements, using subscripts (sinking letters).
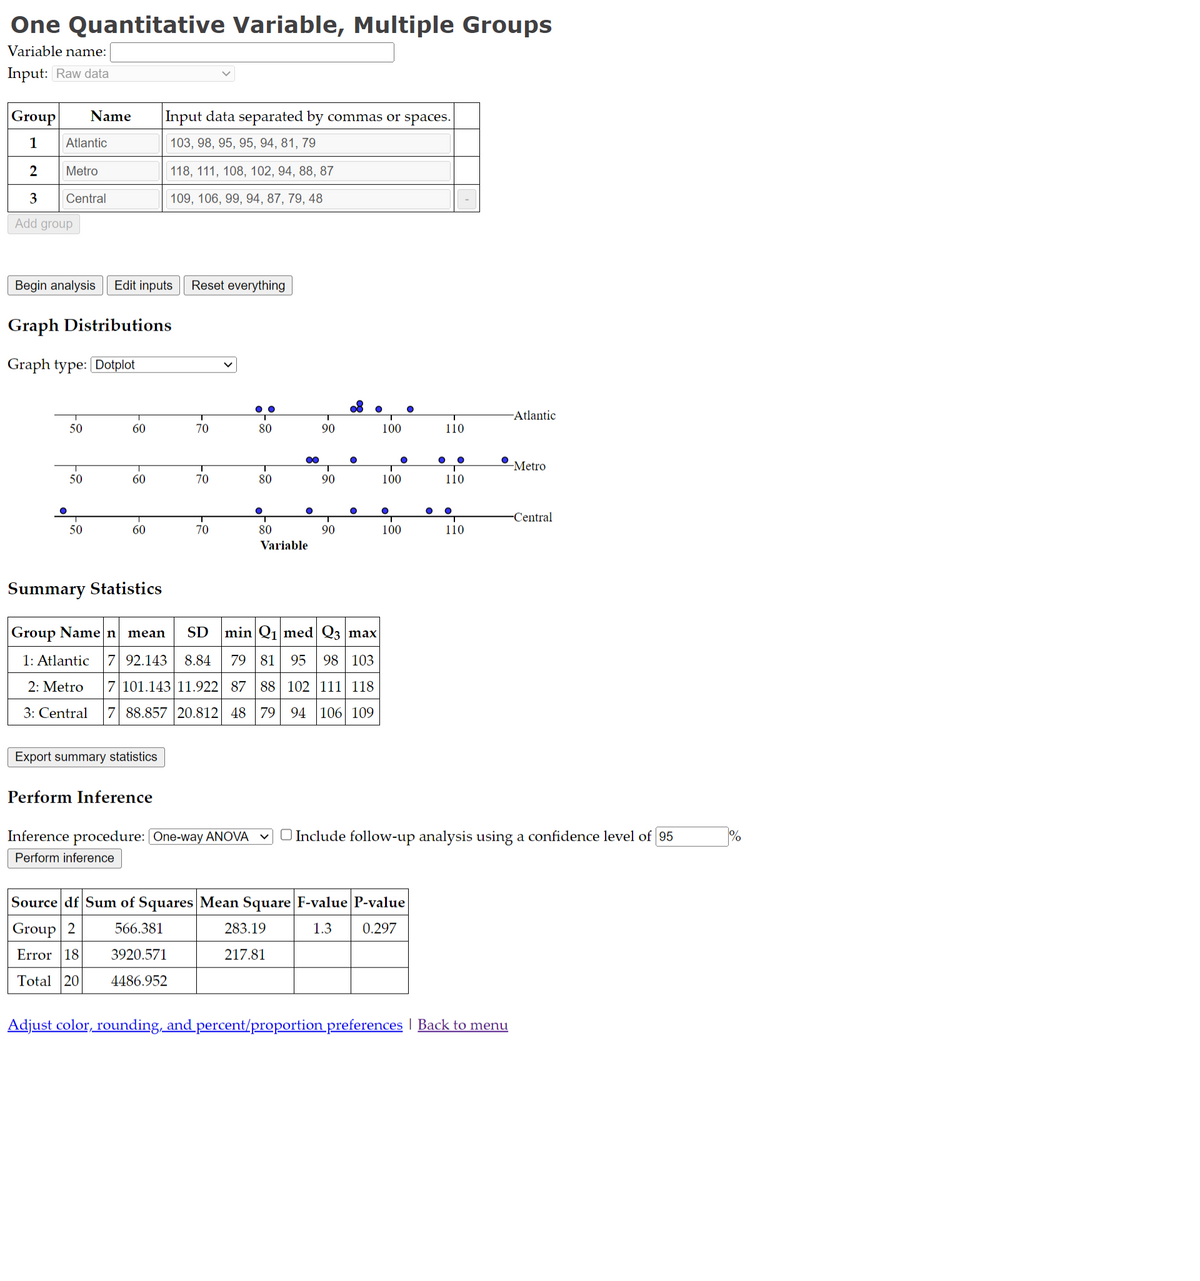

Transcribed Image Text:One Quantitative Variable, Multiple Groups
Variable name:
Input: Raw data
Group Name
1
2
3
Add group
Atlantic
Metro
Central
Begin analysis Edit inputs
Graph Distributions
Graph type: [Dotplot
O
50
50
50
60
60
60
Input data separated by commas or spaces.
103, 98, 95, 95, 94, 81, 79
118, 111, 108, 102, 94, 88, 87
109, 106, 99, 94, 87, 79, 48
Export summary statistics
Perform Inference
Reset everything
70
70
70
00
80
80
●
∞
●
80
Variable
90
283.19
217.81
90
Summary Statistics
Group Name n mean
SD min Q₁ med Q3 max
1: Atlantic 7 92.143 8.84 79 81 95 98 103
2: Metro
7 101.143 11.922 87 88 102 111 118
3: Central 7 88.857 20.812 48 79 94 106 109
90
●
100
●
100
O
100
Source df Sum of Squares Mean Square F-value P-value
Group 2
566.381
1.3 0.297
Error 18
3920.571
Total 20
4486.952
110
O
110
● O
110
-Atlantic
Inference procedure: [One-way ANOVA Include follow-up analysis using a confidence level of 95
Perform inference
-Metro
-Central
Adjust color, rounding, and percent/proportion preferences | Back to menu
Expert Solution
This question has been solved!
Explore an expertly crafted, step-by-step solution for a thorough understanding of key concepts.

This is a popular solution

Trending nowThis is a popular solution!

Step by stepSolved in 4 steps with 5 images

Knowledge Booster

Similar questions
- Describe about the four possible outcomes for any hypothesis test.arrow_forwardplease with excel formulas.arrow_forwardIf the jury returned a verdict of guilty when in reality the defendant is innocent, they made: made a correct decision. made a Type 2 error none of the answers made a Type 1 error.arrow_forward
- a study is done to test the claim that Company A retains its workers longer than Company B. write the hypothesis in symbolic form?arrow_forwardComplete all six steps of hypothesis tesitng. A college president wanted to know how 10-year-after-graduation salaries for academic majors (English, psychology, math, etc.) compared to salaries for career-oriented majors (business, engineering, computer science, etc.). She matched 84 academic majors at her college with 84 career-oriented majors on the basis of SAT scores and GPA. She found MAcademic = $59,250, MCareer =$61,000, sD = 9,500. Analyze and interpret.arrow_forwardWhich rule(s) of inference are used? Question 6 Samantha will bring brownies or chocolate chip cookies to the party. Samantha did not bring brownies, therefore she brought chocolate chip cookies.arrow_forward
- Please Answert the questions in the photo. Thank You!arrow_forwardThe logic behind a statistical test of hypothesis is similar to the following logic. Draw two lines on a paper and determine whether they are of different lengths. You compare them and say,"Well, certainly they are not equal. Therefore they must be of different lengths. By rejecting equality, that is, the null hypothesis, you assert that there is a differencearrow_forwardFor each statement, select the correct null hypothesis, Ho, and alternative hypothesis, Ha, in symbolic form.arrow_forward
- Laura spends an average of 1.5 hours doing her homework. After organizing her desk, Laura thinks she will spend less time doing her homework. She wants to the test that claim. Please show ALL work and explanations! Thank You! A.)State the null hypothesis. B.)State the alternative hypothesisarrow_forwardAt a nearby college, there is a school-sponsored website that matches people looking for roommates. According to the school's reports, 39% of students will find a match their first time using the site. A writer for the school newspaper tests this claim by choosing a random sample of 160 students who visited the site looking for a roommate. Of the students surveyed, 54 said they found a match their first time using the site. Complete the parts below to perform a hypothesis test to see if there is enough evidence, at the 0.10 level of significance, to reject the claim that the proportion, p, of all students who will find a match their first time using the site is 39%. (a) State the null hypothesis H, and the alternative hypothesis H₁ that you would use for the test. Ho: H₁:0 р 0<0 0<0 □□ 0=0 (b) For your hypothesis test, you will use a Z-test. Find the values of np and n (1-p) to confirm that a Z-test can be used. (One standard is that np≥ 10 and (1-p) ≥10 under the assumption that the…arrow_forwardIn most judicial systems, a defendant is innocent until proven guilty. An attorney defends the null hypothesis that his client, the defendant, is innocent. From the judge’s point of view, what are the implications of making the following types of errors? A Type I error A Type II errorarrow_forward
arrow_back_ios
SEE MORE QUESTIONS
arrow_forward_ios
Recommended textbooks for you
- MATLAB: An Introduction with ApplicationsStatisticsISBN:9781119256830Author:Amos GilatPublisher:John Wiley & Sons Inc
 Probability and Statistics for Engineering and th...StatisticsISBN:9781305251809Author:Jay L. DevorePublisher:Cengage Learning
 Statistics for The Behavioral Sciences (MindTap C...StatisticsISBN:9781305504912Author:Frederick J Gravetter, Larry B. WallnauPublisher:Cengage Learning
  Elementary Statistics: Picturing the World (7th E...StatisticsISBN:9780134683416Author:Ron Larson, Betsy FarberPublisher:PEARSON
 The Basic Practice of StatisticsStatisticsISBN:9781319042578Author:David S. Moore, William I. Notz, Michael A. FlignerPublisher:W. H. Freeman
 Introduction to the Practice of StatisticsStatisticsISBN:9781319013387Author:David S. Moore, George P. McCabe, Bruce A. CraigPublisher:W. H. Freeman
MATLAB: An Introduction with Applications
Statistics
ISBN:9781119256830
Author:Amos Gilat
Publisher:John Wiley & Sons Inc
Probability and Statistics for Engineering and th...
Statistics
ISBN:9781305251809
Author:Jay L. Devore
Publisher:Cengage Learning
Statistics for The Behavioral Sciences (MindTap C...
Statistics
ISBN:9781305504912
Author:Frederick J Gravetter, Larry B. Wallnau
Publisher:Cengage Learning
Elementary Statistics: Picturing the World (7th E...
Statistics
ISBN:9780134683416
Author:Ron Larson, Betsy Farber
Publisher:PEARSON
The Basic Practice of Statistics
Statistics
ISBN:9781319042578
Author:David S. Moore, William I. Notz, Michael A. Fligner
Publisher:W. H. Freeman
Introduction to the Practice of Statistics
Statistics
ISBN:9781319013387
Author:David S. Moore, George P. McCabe, Bruce A. Craig
Publisher:W. H. Freeman