A good truck did a daily a survey of customers to find their food preferences. The data is partially entered in the frequency table complete the table to analyze the data and answer the questions: part a: what percentage of the survey respondents do not like both of hamburgers and burritos? Part b: what is the marginal relative frequency of all customers that like hamburgers? Part c: use the conditional relative frequency to determine what state of Point has strongest Association of its two factors. Use complete sentences to explain your answer.
A good truck did a daily a survey of customers to find their food preferences. The data is partially entered in the frequency table complete the table to analyze the data and answer the questions: part a: what percentage of the survey respondents do not like both of hamburgers and burritos? Part b: what is the marginal relative frequency of all customers that like hamburgers? Part c: use the conditional relative frequency to determine what state of Point has strongest Association of its two factors. Use complete sentences to explain your answer.

Big Ideas Math A Bridge To Success Algebra 1: Student Edition 2015
1st Edition
ISBN:9781680331141
Author:HOUGHTON MIFFLIN HARCOURT
Publisher:HOUGHTON MIFFLIN HARCOURT
Chapter11: Data Analysis And Displays
Section: Chapter Questions
Problem 12CR

Related questions

Topic Video
Question
A good truck did a daily a survey of customers to find their food preferences. The data is partially entered in the frequency table complete the table to analyze the data and answer the questions: part a: what percentage of the survey respondents do not like both of hamburgers and burritos? Part b: what is the marginal relative frequency of all customers that like hamburgers? Part c: use the conditional relative frequency to determine what state of Point has strongest Association of its two factors. Use complete sentences to explain your answer.
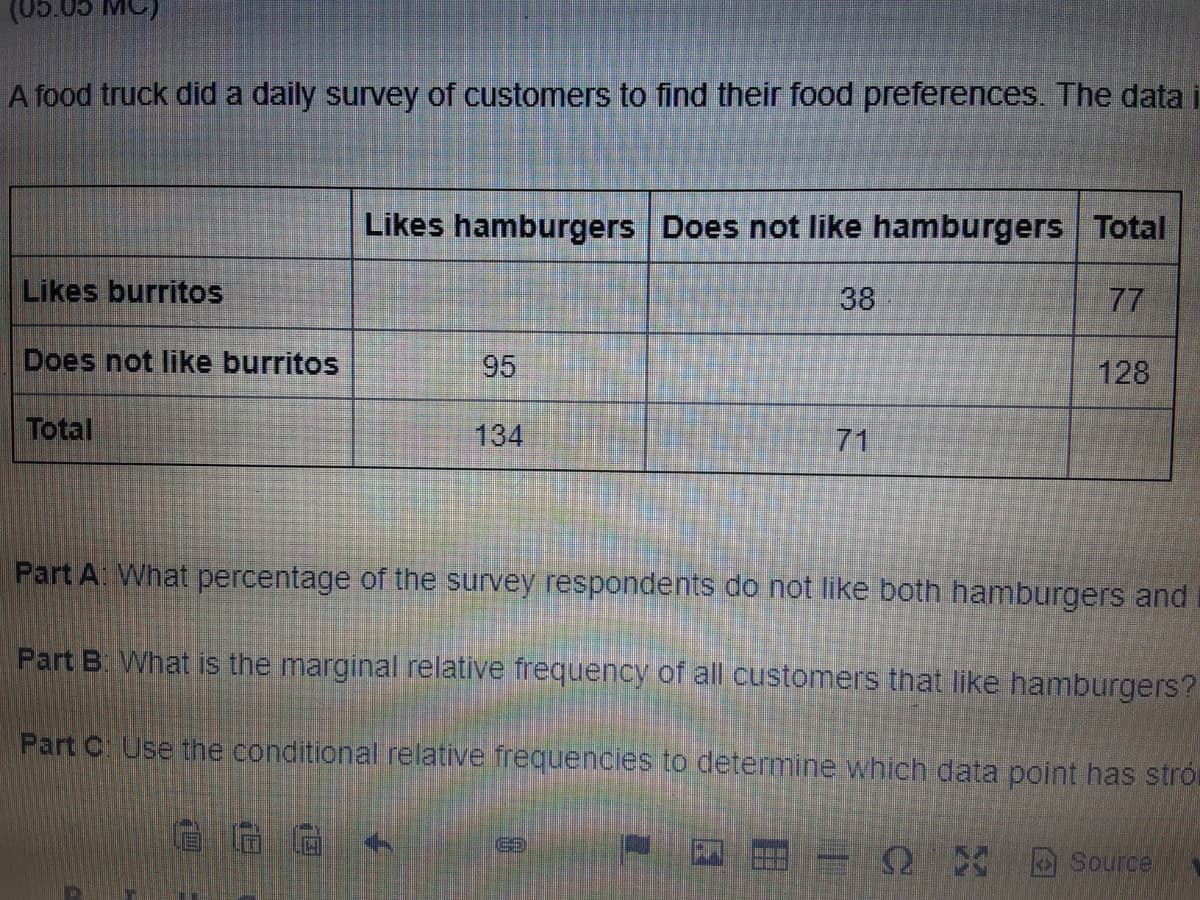
Transcribed Image Text:(05.05 MC)
A food truck did a daily survey of customers to find their food preferences. The data i
Likes hamburgers Does not like hamburgers Total
Likes burritos
38
77
Does not like burritos
95
128
Total
134
71
Part A. What percentage of the survey respondents do not like both hamburgers and
Part B. What is the marginal relative frequency of all customers that like hamburgers?
Part C Use the conditional relative frequencies to determine which data point has stro
Source
間
Expert Solution
This question has been solved!
Explore an expertly crafted, step-by-step solution for a thorough understanding of key concepts.

This is a popular solution!

Trending now
This is a popular solution!

Step by step
Solved in 3 steps with 5 images

Knowledge Booster


Learn more about
Need a deep-dive on the concept behind this application? Look no further. Learn more about this topic, statistics and related others by exploring similar questions and additional content below.Recommended textbooks for you
Big Ideas Math A Bridge To Success Algebra 1: Stu…
Algebra
ISBN:
9781680331141
Author:
HOUGHTON MIFFLIN HARCOURT
Publisher:
Houghton Mifflin Harcourt

Glencoe Algebra 1, Student Edition, 9780079039897…
Algebra
ISBN:
9780079039897
Author:
Carter
Publisher:
McGraw Hill

Holt Mcdougal Larson Pre-algebra: Student Edition…
Algebra
ISBN:
9780547587776
Author:
HOLT MCDOUGAL
Publisher:
HOLT MCDOUGAL
Big Ideas Math A Bridge To Success Algebra 1: Stu…
Algebra
ISBN:
9781680331141
Author:
HOUGHTON MIFFLIN HARCOURT
Publisher:
Houghton Mifflin Harcourt
Glencoe Algebra 1, Student Edition, 9780079039897…
Algebra
ISBN:
9780079039897
Author:
Carter
Publisher:
McGraw Hill
Holt Mcdougal Larson Pre-algebra: Student Edition…
Algebra
ISBN:
9780547587776
Author:
HOLT MCDOUGAL
Publisher:
HOLT MCDOUGAL