A health policy economist interested in investigating the relationship between the cost of prescription drugs in United States has information from a random sample of 48 prescription drugs sold in both countries. For each of these drugs, the economist is examining two pieces of information: the average cost of a one-month supply of the drug in Canada, and the average cost of a one-month supply of the drug in the United States. For the sample of drugs examined, the sample correlation coefficient r relating these two pieces of information is 0.33. and the cost of prescription Test for a significant linear relationship between the two variables average prescription drug cost in Canada and average prescription drug cost in the United States by doing a hypothesis test regarding the population correlation coefficient p. (Assume that the two variables have a bivariate normal distribution.) Use the 0.05 level of significance, and perform a two-tailed test. Then complete the parts below. (If necessary, consult a list of formulas.) (a) State the null hypothesis H, and the alternative hypothesis H. Ho :0 H, 0 OSO (b) Determine the type of test statistic to use. (Choose one) ▼ (c) Find the value of the test statistic. (Round to three or more decimal places.) (d) Find the two critical values at the 0.05 level of significance. (Round to three or more decimal places.) O and O (e) Based on the data, can the economist conclude (using the 0,05 level) that there is a significant linear relationship between the average prescription drug cost in Canada and the average prescription drug cost in the United States? Yes No 口口 Ix
A health policy economist interested in investigating the relationship between the cost of prescription drugs in United States has information from a random sample of 48 prescription drugs sold in both countries. For each of these drugs, the economist is examining two pieces of information: the average cost of a one-month supply of the drug in Canada, and the average cost of a one-month supply of the drug in the United States. For the sample of drugs examined, the sample correlation coefficient r relating these two pieces of information is 0.33. and the cost of prescription Test for a significant linear relationship between the two variables average prescription drug cost in Canada and average prescription drug cost in the United States by doing a hypothesis test regarding the population correlation coefficient p. (Assume that the two variables have a bivariate normal distribution.) Use the 0.05 level of significance, and perform a two-tailed test. Then complete the parts below. (If necessary, consult a list of formulas.) (a) State the null hypothesis H, and the alternative hypothesis H. Ho :0 H, 0 OSO (b) Determine the type of test statistic to use. (Choose one) ▼ (c) Find the value of the test statistic. (Round to three or more decimal places.) (d) Find the two critical values at the 0.05 level of significance. (Round to three or more decimal places.) O and O (e) Based on the data, can the economist conclude (using the 0,05 level) that there is a significant linear relationship between the average prescription drug cost in Canada and the average prescription drug cost in the United States? Yes No 口口 Ix

Functions and Change: A Modeling Approach to College Algebra (MindTap Course List)
6th Edition
ISBN:9781337111348
Author:Bruce Crauder, Benny Evans, Alan Noell
Publisher:Bruce Crauder, Benny Evans, Alan Noell
Chapter5: A Survey Of Other Common Functions
Section5.3: Modeling Data With Power Functions
Problem 6E: Urban Travel Times Population of cities and driving times are related, as shown in the accompanying...

Related questions
Question
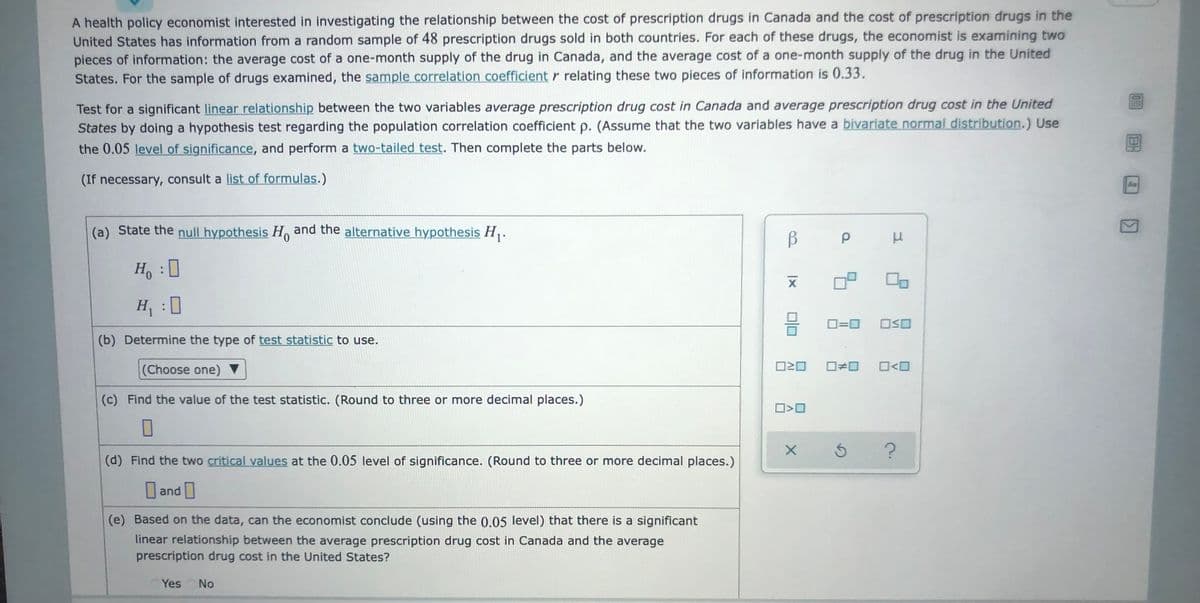
Transcribed Image Text:A health policy economist interested in investigating the relationship between the cost of prescription drugs in Canada and the cost of prescription drugs in the
United States has information from a random sample of 48 prescription drugs sold in both countries. For each of these drugs, the economist is examining two
pieces of information: the average cost of a one-month supply of the drug in Canada, and the average cost of a one-month supply of the drug in the United
States. For the sample of drugs examined, the sample correlation coefficient r relating these two pieces of information is 0.33.
Test for a significant linear relationship between the two variables average prescription drug cost in Canada and average prescription drug cost in the United
States by doing a hypothesis test regarding the population correlation coefficient p. (Assume that the two variables have a bivariate normal distribution.) Use
the 0.05 level of significance, and perform a two-tailed test. Then complete the parts below.
(If necessary, consult a list of formulas.)
Aa
(a) State the null hypothesis Ho and the alternative hypothesis H,.
B
Ho : 0
H : 0
O=0
(b) Determine the type of test statistic to use.
(Choose one) ▼
(c) Find the value of the test statistic. (Round to three or more decimal places.)
(d) Find the two critical values at the 0.05 level of significance. (Round to three or more decimal places.)
and
|
(e) Based on the data, can the economist conclude (using the 0.05 level) that there is a significant
linear relationship between the average prescription drug cost in Canada and the average
prescription drug cost in the United States?
Yes
No
Expert Solution
This question has been solved!
Explore an expertly crafted, step-by-step solution for a thorough understanding of key concepts.

This is a popular solution!

Trending now
This is a popular solution!

Step by step
Solved in 2 steps with 4 images

Recommended textbooks for you
Functions and Change: A Modeling Approach to Coll…
Algebra
ISBN:
9781337111348
Author:
Bruce Crauder, Benny Evans, Alan Noell
Publisher:
Cengage Learning

Glencoe Algebra 1, Student Edition, 9780079039897…
Algebra
ISBN:
9780079039897
Author:
Carter
Publisher:
McGraw Hill
Functions and Change: A Modeling Approach to Coll…
Algebra
ISBN:
9781337111348
Author:
Bruce Crauder, Benny Evans, Alan Noell
Publisher:
Cengage Learning
Glencoe Algebra 1, Student Edition, 9780079039897…
Algebra
ISBN:
9780079039897
Author:
Carter
Publisher:
McGraw Hill