Listed below are numbers of Internet users per 100 people and numbers of scientific award winners per 10 million people for different countries. Construct a scatterplot, find the value of the linear correlation coefficient r, and find the P-value of r. Determine whether there is sufficient evidence to support a claim of linear correlation between the two variables. Use a significance level of a = 0.01. Internet Users 78.5 79.8 55.8 68.9 78.4 38.0 D Award Winners 5.4 8.7 3.3 1.8 10.5 0.1 ... Construct a scatterplot. Choose the correct graph below. OA. OB OD. 12- 12 1 ㄩ 30 90 Internet Users 30 90 Internet Users Internet Users Internet Users The linear correlation coefficient is r= (Round three decimal places as needed.) ward Winners Award Winners
Listed below are numbers of Internet users per 100 people and numbers of scientific award winners per 10 million people for different countries. Construct a scatterplot, find the value of the linear correlation coefficient r, and find the P-value of r. Determine whether there is sufficient evidence to support a claim of linear correlation between the two variables. Use a significance level of a = 0.01. Internet Users 78.5 79.8 55.8 68.9 78.4 38.0 D Award Winners 5.4 8.7 3.3 1.8 10.5 0.1 ... Construct a scatterplot. Choose the correct graph below. OA. OB OD. 12- 12 1 ㄩ 30 90 Internet Users 30 90 Internet Users Internet Users Internet Users The linear correlation coefficient is r= (Round three decimal places as needed.) ward Winners Award Winners

Glencoe Algebra 1, Student Edition, 9780079039897, 0079039898, 2018
18th Edition
ISBN:9780079039897
Author:Carter
Publisher:Carter
Chapter10: Statistics
Section10.4: Distributions Of Data
Problem 19PFA

Related questions
Question
-What is test statistics?
-What is the P value?
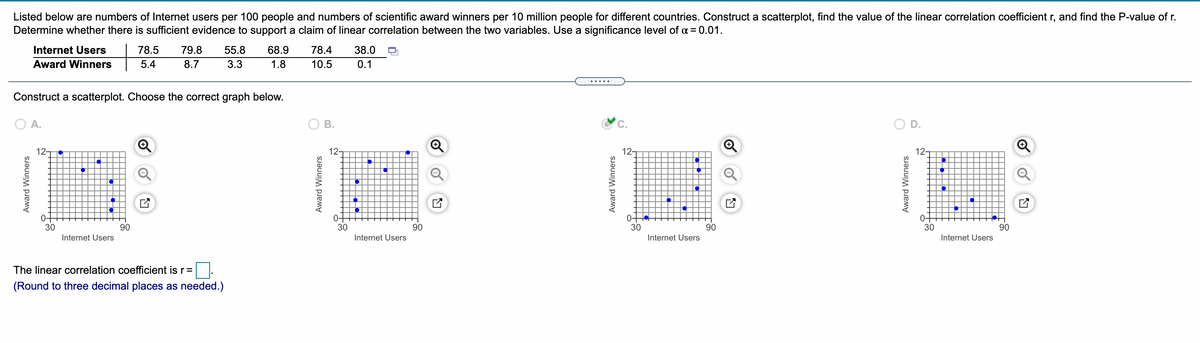
Transcribed Image Text:Listed below are numbers of Internet users per 100 people and numbers of scientific award winners per 10 million people for different countries. Construct a scatterplot, find the value of the linear correlation coefficient r, and find the P-value of r.
Determine whether there is sufficient evidence to support a claim of linear correlation between the two variables. Use a significance level of a = 0.01.
Internet Users
78.5
79.8
55.8
68.9
78.4
38.0
Award Winners
5.4
8.7
3.3
1.8
10.5
0.1
.....
Construct a scatterplot. Choose the correct graph below.
A.
В.
D.
12-
12-
12-
12-
0-
30
0-
30
0-
30
0-
30
90
90
90
90
Internet Users
Internet Users
Internet Users
Internet Users
The linear correlation coefficient is r=
(Round to three decimal places as needed.)
Award Winners
Award Winners
Award Winners
Award Winners
Expert Solution
This question has been solved!
Explore an expertly crafted, step-by-step solution for a thorough understanding of key concepts.

This is a popular solution!

Trending now
This is a popular solution!

Step by step
Solved in 4 steps with 1 images

Recommended textbooks for you
Glencoe Algebra 1, Student Edition, 9780079039897…
Algebra
ISBN:
9780079039897
Author:
Carter
Publisher:
McGraw Hill
Glencoe Algebra 1, Student Edition, 9780079039897…
Algebra
ISBN:
9780079039897
Author:
Carter
Publisher:
McGraw Hill