A manufacturer bonds a plastic coating to a metal surface. A random sample of nine observations on the thickness of this coating is taken from a week's output and the thickness (in millimeters) of these observations are shown below. Assuming normality, find a 90% confidence interval for the population variance. 19.4 21.9 18.6 20.9 21.4 19.1 19.4 20.4 20.6 Click the icon to view a table of lower critical values for the chi-squ 1 Lower Critical Values of Chi-Square O Upper Critical Values of Chi-Square E Click the icon to view a table of upper critical values for the chi-squ Find the 90% confidence interval. 0.90 0.95 0.975 0.99 0.999 0.10 0.05 0.025 0.01 0.001 10.828 13.816 1 .016 .004 001 .000 000 1 2.706 3.841 5.024 6.635 211 .103 051 020 .002 4.605 5.991 7.378 9.210 (Round to four decimal places as needed.) 3 .584 352 216 .115 .024 6.251 7.815 9.348 11.345 16.266 4 1.064 .711 484 .297 .091 18.467 20.515 4 7.779 9.488 11.143 13.277 1.610 1.145 831 554 .210 9,236 11.070 12.833 15.086 6. 2.204 1.635 1.237 872 381 12.502 14.067 6. 10.645 14.449 16.812 22.458 7. 2.833 2.167 1.690 1.239 598 7 12.017 16.013 18.475 24.322 3.490 2.733 2.180 1.646 857 1325 2088 8. 13.362 15.507 17.535 20.090 26.125 4168 2700 1152
A manufacturer bonds a plastic coating to a metal surface. A random sample of nine observations on the thickness of this coating is taken from a week's output and the thickness (in millimeters) of these observations are shown below. Assuming normality, find a 90% confidence interval for the population variance. 19.4 21.9 18.6 20.9 21.4 19.1 19.4 20.4 20.6 Click the icon to view a table of lower critical values for the chi-squ 1 Lower Critical Values of Chi-Square O Upper Critical Values of Chi-Square E Click the icon to view a table of upper critical values for the chi-squ Find the 90% confidence interval. 0.90 0.95 0.975 0.99 0.999 0.10 0.05 0.025 0.01 0.001 10.828 13.816 1 .016 .004 001 .000 000 1 2.706 3.841 5.024 6.635 211 .103 051 020 .002 4.605 5.991 7.378 9.210 (Round to four decimal places as needed.) 3 .584 352 216 .115 .024 6.251 7.815 9.348 11.345 16.266 4 1.064 .711 484 .297 .091 18.467 20.515 4 7.779 9.488 11.143 13.277 1.610 1.145 831 554 .210 9,236 11.070 12.833 15.086 6. 2.204 1.635 1.237 872 381 12.502 14.067 6. 10.645 14.449 16.812 22.458 7. 2.833 2.167 1.690 1.239 598 7 12.017 16.013 18.475 24.322 3.490 2.733 2.180 1.646 857 1325 2088 8. 13.362 15.507 17.535 20.090 26.125 4168 2700 1152

MATLAB: An Introduction with Applications
6th Edition
ISBN:9781119256830
Author:Amos Gilat
Publisher:Amos Gilat
Chapter1: Starting With Matlab
Section: Chapter Questions
Problem 1P

Related questions
Topic Video
Question
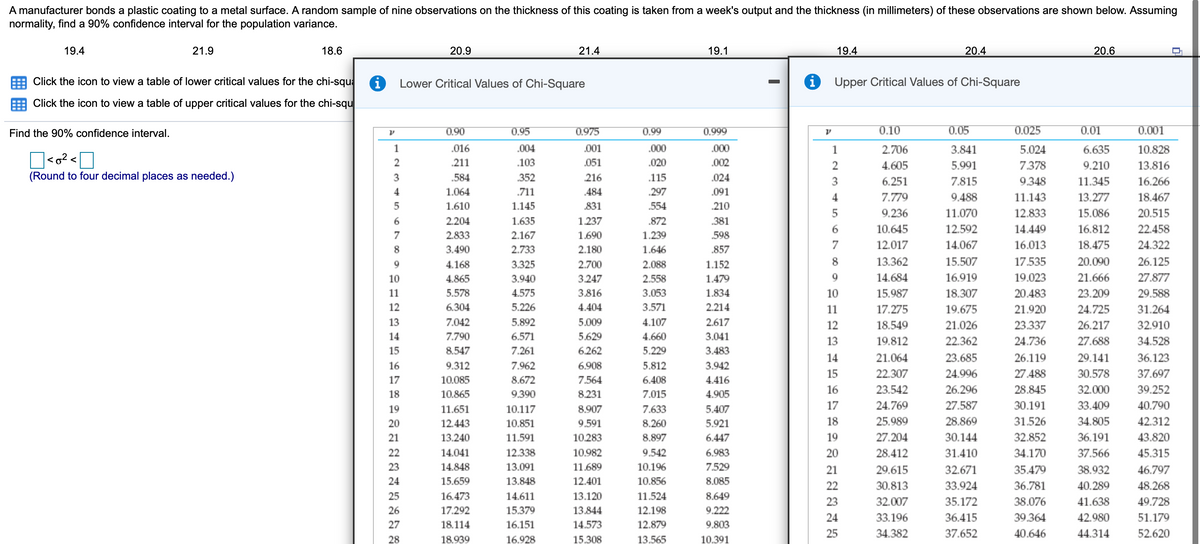
Transcribed Image Text:A manufacturer bonds a plastic coating to a metal surface. A random sample of nine observations on the thickness of this coating is taken from a week's output and the thickness (in millimeters) of these observations are shown below. Assuming
normality, find a 90% confidence interval for the population variance.
19.4
21.9
18.6
20.9
21.4
19.1
19.4
20.4
20.6
Click the icon to view a table of lower critical values for the chi-squa
Lower Critical Values of Chi-Square
i Upper Critical Values of Chi-Square
Click the icon to view a table of upper critical values for the chi-squ
Find the 90% confidence interval.
0.90
0.95
0.975
0.99
0.999
0.10
0.05
0.025
0.01
0.001
1
.016
.004
.001
.000
.000
1
2.706
3.841
5.024
6.635
10.828
<o? <
(Round to four decimal places as needed.)
.211
.103
.051
.020
.002
4.605
5.991
7.378
9.210
13.816
.584
352
216
.115
.024
3
6.251
7.815
9.348
11.345
16.266
4
1.064
.711
484
.297
.091
4
7.779
9.488
11.143
13.277
18.467
1.610
1.145
831
.554
.210
5
9.236
11.070
12.833
15.086
20.515
6.
2.204
1.635
1.237
.872
.381
10.645
12.592
14.449
16.812
22.458
7
2.833
2.167
1.690
1.239
598
7
12.017
14.067
16.013
18.475
24.322
8
3.490
2.733
2.180
1.646
.857
4.168
3.325
2.700
2.088
1.152
8
13.362
15.507
17.535
20.090
26.125
10
4.865
3.940
3.247
2.558
1.479
14.684
16.919
19.023
21.666
27.877
11
5.578
4.575
3.816
3.053
1.834
10
15.987
18.307
20.483
23.209
29.588
12
6.304
5.226
4.404
3.571
2.214
11
17.275
19.675
21.920
24.725
31.264
13
7.042
5.892
5.009
4.107
2.617
12
18.549
21.026
23.337
26.217
32.910
14
7.790
6.571
5.629
4.660
3.041
13
19.812
22.362
24.736
27.688
34.528
15
8.547
7.261
6.262
5.229
3.483
14
21.064
23.685
26.119
29.141
36.123
16
9.312
7.962
6.908
5.812
3.942
15
22.307
24.996
27.488
30.578
37.697
17
10.085
8.672
7.564
6.408
4.416
16
23.542
26.296
28.845
32.000
39.252
18
10.865
9.390
8.231
7.015
4.905
19
11.651
10.117
8.907
7.633
5.407
17
24.769
27.587
30.191
33.409
40.790
20
12.443
10.851
9.591
8.260
5.921
18
25.989
28.869
31.526
34.805
42.312
21
13.240
11.591
10.283
8.897
6.447
19
27.204
30.144
32.852
36.191
43.820
22
14.041
12.338
10.982
9.542
6.983
20
28.412
31.410
34.170
37.566
45.315
23
14.848
13.091
11.689
10.196
7.529
21
29.615
32.671
35.479
38.932
46.797
24
15.659
13.848
12.401
10.856
8.085
22
30.813
33.924
36.781
40.289
48.268
25
16.473
14.611
13.120
11.524
8.649
23
32.007
35.172
38.076
41.638
49.728
26
17.292
15.379
13.844
12.198
9.222
24
33.196
36.415
39.364
42.980
51.179
27
18.114
16.151
14.573
12.879
9.803
25
34.382
37.652
40.646
44.314
52.620
28
18.939
16.928
15.308
13.565
10.391
Expert Solution
This question has been solved!
Explore an expertly crafted, step-by-step solution for a thorough understanding of key concepts.

This is a popular solution!

Trending now
This is a popular solution!

Step by step
Solved in 2 steps with 3 images

Knowledge Booster


Learn more about
Need a deep-dive on the concept behind this application? Look no further. Learn more about this topic, statistics and related others by exploring similar questions and additional content below.Recommended textbooks for you
MATLAB: An Introduction with Applications
Statistics
ISBN:
9781119256830
Author:
Amos Gilat
Publisher:
John Wiley & Sons Inc

Probability and Statistics for Engineering and th…
Statistics
ISBN:
9781305251809
Author:
Jay L. Devore
Publisher:
Cengage Learning

Statistics for The Behavioral Sciences (MindTap C…
Statistics
ISBN:
9781305504912
Author:
Frederick J Gravetter, Larry B. Wallnau
Publisher:
Cengage Learning
MATLAB: An Introduction with Applications
Statistics
ISBN:
9781119256830
Author:
Amos Gilat
Publisher:
John Wiley & Sons Inc
Probability and Statistics for Engineering and th…
Statistics
ISBN:
9781305251809
Author:
Jay L. Devore
Publisher:
Cengage Learning
Statistics for The Behavioral Sciences (MindTap C…
Statistics
ISBN:
9781305504912
Author:
Frederick J Gravetter, Larry B. Wallnau
Publisher:
Cengage Learning

Elementary Statistics: Picturing the World (7th E…
Statistics
ISBN:
9780134683416
Author:
Ron Larson, Betsy Farber
Publisher:
PEARSON

The Basic Practice of Statistics
Statistics
ISBN:
9781319042578
Author:
David S. Moore, William I. Notz, Michael A. Fligner
Publisher:
W. H. Freeman

Introduction to the Practice of Statistics
Statistics
ISBN:
9781319013387
Author:
David S. Moore, George P. McCabe, Bruce A. Craig
Publisher:
W. H. Freeman