(PX) time (in minutes) of college students to write an error-free program (y). Assuming normality of both populations, compute a 90% confidence interval estimate for (μx - μy). Data taken from two independent samples were summarized as follows: Statistics High School College Mean time 70 84 Standard deviation 10 12 Sample size 10 10
(PX) time (in minutes) of college students to write an error-free program (y). Assuming normality of both populations, compute a 90% confidence interval estimate for (μx - μy). Data taken from two independent samples were summarized as follows: Statistics High School College Mean time 70 84 Standard deviation 10 12 Sample size 10 10

MATLAB: An Introduction with Applications
6th Edition
ISBN:9781119256830
Author:Amos Gilat
Publisher:Amos Gilat
Chapter1: Starting With Matlab
Section: Chapter Questions
Problem 1P

Related questions
Question
12
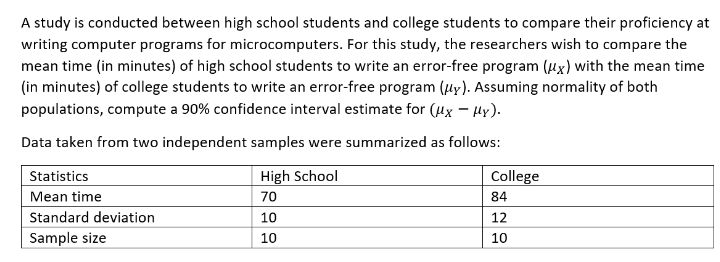
Transcribed Image Text:A study is conducted between high school students and college students to compare their proficiency at
writing computer programs for microcomputers. For this study, the researchers wish to compare the
mean time (in minutes) of high school students to write an error-free program (x) with the mean time
(in minutes) of college students to write an error-free program (uy). Assuming normality of both
populations, compute a 90% confidence interval estimate for (μx - μy).
Data taken from two independent samples were summarized as follows:
Statistics
High School
College
84
Mean time
70
Standard deviation
10
12
Sample size
10
10
Expert Solution
This question has been solved!
Explore an expertly crafted, step-by-step solution for a thorough understanding of key concepts.

Step by step
Solved in 2 steps with 2 images

Recommended textbooks for you
MATLAB: An Introduction with Applications
Statistics
ISBN:
9781119256830
Author:
Amos Gilat
Publisher:
John Wiley & Sons Inc

Probability and Statistics for Engineering and th…
Statistics
ISBN:
9781305251809
Author:
Jay L. Devore
Publisher:
Cengage Learning

Statistics for The Behavioral Sciences (MindTap C…
Statistics
ISBN:
9781305504912
Author:
Frederick J Gravetter, Larry B. Wallnau
Publisher:
Cengage Learning
MATLAB: An Introduction with Applications
Statistics
ISBN:
9781119256830
Author:
Amos Gilat
Publisher:
John Wiley & Sons Inc
Probability and Statistics for Engineering and th…
Statistics
ISBN:
9781305251809
Author:
Jay L. Devore
Publisher:
Cengage Learning
Statistics for The Behavioral Sciences (MindTap C…
Statistics
ISBN:
9781305504912
Author:
Frederick J Gravetter, Larry B. Wallnau
Publisher:
Cengage Learning

Elementary Statistics: Picturing the World (7th E…
Statistics
ISBN:
9780134683416
Author:
Ron Larson, Betsy Farber
Publisher:
PEARSON

The Basic Practice of Statistics
Statistics
ISBN:
9781319042578
Author:
David S. Moore, William I. Notz, Michael A. Fligner
Publisher:
W. H. Freeman

Introduction to the Practice of Statistics
Statistics
ISBN:
9781319013387
Author:
David S. Moore, George P. McCabe, Bruce A. Craig
Publisher:
W. H. Freeman