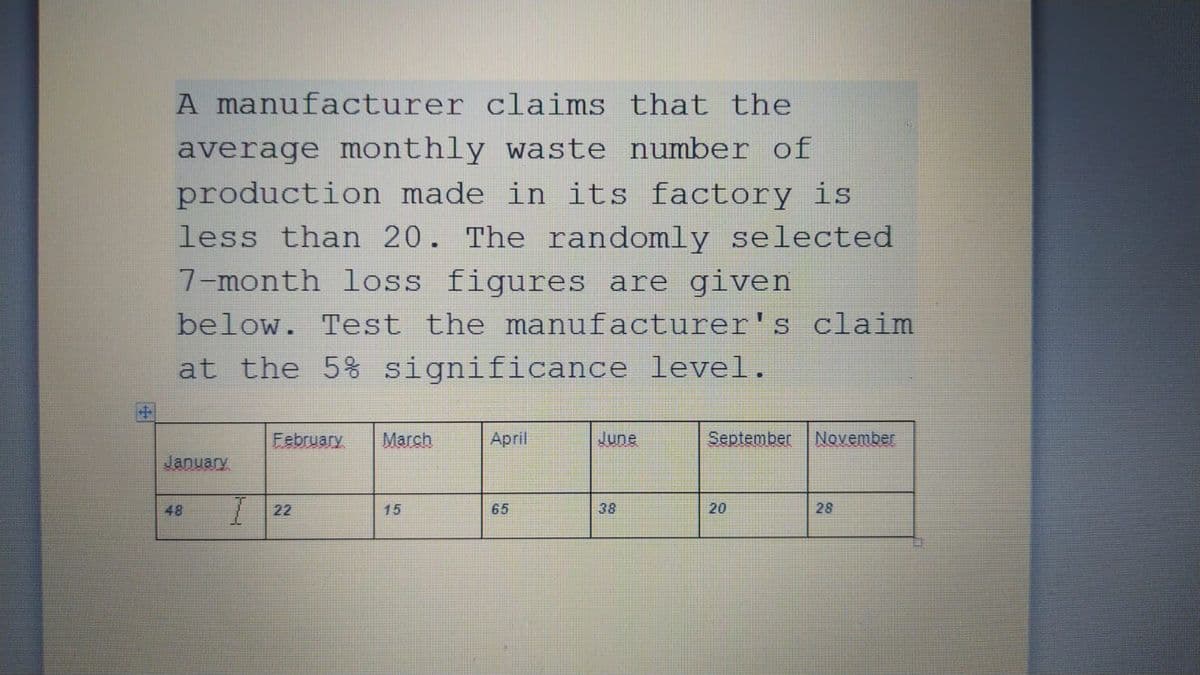
A manufacturer claims that the average monthly waste number of production made in its factory is less than 20. The randomly selected 7-month loss figures are given below. Test the manufacturer's claim at the 5% significance level. February March April June September November January 48 || 22 15 65 38 20 28
Q: A random sample of sale prices of homes in Lexington, Kentucky, yielded the following summary…
A: Given : sale price = $426000 Outer fence=Q3+1.5×IQR Outer fence=160000+1.5×(160000-82000) Outer…
Q: In a survey of smartphone usage, randomly selected users were asked to record their talk tíme in…
A: The test statistic can be calculated using following formula: t = x-usnwhere, x = sample meanu =…
Q: Speed Dating Listed below are attribute ratings of males by females who participated in speed dating…
A: The hypotheses are given below:Null hypothesis:H0: µ1= µ2= µ3.Alternative hypothesis:H1: At least…
Q: Brand A :11 17 29 10 28 37 29 31 19 44 Brand B: 22 16 28 12 18 36 23 11 41 29 At the 0.01%…
A: Consider the given data in the followoing table we have the mean values of Brand A (X) and Brand B…
Q: A stock analyst wondered whether the mean rate of return of financial, energy, and utility stocks…
A: To test whether the mean rate of return of financial, energy, and utility stocks differed over the…
Q: The Wall Street Journal Corporate Perceptions Study 2011 surveyed readers and asked how each rated…
A: There are two variables which are named as quality of management and reputation of company. Quality…
Q: A process that produces bottles of shampoo, when operating correctly, produces bottles whose…
A: Given, n=9 μ=20 21.4 19.3 19 21.6 20.4 20.1 19.1 20.3 20.9
Q: To study the effect of temperature on yield in a chemical process, five batches were produced at…
A: To compare the means of more than 2 groups the ANOVA F test is used. In this test the null…
Q: a) Compute the standard deviation for each of the variables. b) Compute the covariance between…
A: Given Data : 1) Variable : Grade Count, N: 6 Sum, Σx: 393 Mean, x̄ = Σx / N 65.5…
Q: 2. An insurance company claims that the mean cost to process a claim is $60. An industry comparison…
A: Hypothesized Population Mean (µ) = $ 60 The Calculated sample mean is = $ 56.42 Sample standard…
Q: Select THREE benefits of using within-subjects t-test compared to between- subjects t-test. O No…
A: THREE benefits of using within-subjects t-test compared to between subjects t-test.
Q: . The Hillcrest Golf and Country Club manager selected a random sample of the members and recorded…
A: Arrange the given numbers in non descending order 9 11 12 12 12 13 15 15 16 17…
Q: c) To evaluate whether the assumption of equal variance has been violated, which of the following…
A: Regression analysis
Q: In an experiment to compare the efficiency (in percentage) of different chelating agents (A, B, C,…
A: (a)A one-way analysis of variance (ANOVA) table that includes all relevant information from the…
Q: A newly installed automatic gate system was being tested to see if the number of failures in 1,000…
A: Here Paired T - test is applicable ========================== Entry(A) Exit(B) d(A-B) 42 47…
Q: #3. A study regarding the relationship between age and the amount of pressure sales personnel feel…
A:
Q: Three brands of paint were tested for their ability to withstand fading by painting several panels…
A: The study is to test the three brands of paints for their ability to withstand fading by painting…
Q: In a test of physical fitness, a group of men ages 65 and older from a local retirement community…
A: Introduction:Denote X as the number of sit-ups that a randomly selected man aged 65 years or older…
Q: Do students reduce study time in classes where they achieve a higher midterm score? In a Journal of…
A: (a) The objective is to set up the null and alternative hypotheses to test whether there is a…
Q: A study was conducted to determine whether remediation in statistics enabled students to be more…
A:
Q: b) A company attempts to evaluate the potential for a new bonus plan by selecting a random sample of…
A: We have to perform paired t test for testing the difference in mean.
Q: In a survey of smartphone usage, randomly selected users were asked to record their talk time in…
A:
Q: Test the hypothesis that drunk-driving arrests are equally likely to occur in any month. Use .02…
A: Provided information is, The number of drunk-driving arrests were counted each month by the…
Q: When conducting an ANOVA, what is the purpose of an APA table? Group of answer choices To see…
A: Solution APA format is the output defined in a pattern which contain df ,test value and p value ,…
Q: A corporation administers an aptitude test to all new sales representatives. Management is…
A: We have given that, TEST SCORES(X) WEEKLY SCORE(Y) 55…
Q: A newly installed automatic gate system was being tested to see if the number of failures in 1,000…
A: Given: Truck Entry failures Exit failures 1 40 47 2 42 55 3 51 56 4 55 57 5 64 57…
Q: A psychologist is interested in testing whether there is a difference in the distribution of…
A: Note: Hey there! Thank you for the question. As you have posted a question with multiple sub-parts,…
Q: Perform the analysis of variance (ANOVA) at the 5% significance level to identify is there any…
A: Hello! As you have posted 3 different questions, we are answering the first question. In case you…
Q: Adults aged 18 years old and older were randomly selected for a survey on obesity. Adults are…
A: From the given information, The number who are obese Sample size Men 2766 155525 Women…
Q: 3.2) A study was done to determine if a new diet plan would decrease weight. A random sample of 10…
A: Given: Person Before diet plan After diet plan A 177 168 B 245 241 C 198 197 D 210 205…
Q: The MINITAB analysis uses the pooled estimate of a?. Is the assumption of equal variances…
A: Given that For light water, SD = 0.403 For light oil, SD = 0.668
Q: Consider the data below. Previous studies have shown that approximately 32% of women deliver…
A: Given information:Sample size (n) = 100Significance level = 0.05
Q: A researcher is interested in investigating whether the military branch a person signs up for and…
A: Formula : Test statistic
Q: Does a statistics course improve a student's mathematics skills, as measured by a national test?…
A: Given: Before After 430 465 485 475 520 535 360 410 440 425 500 505 425 450 470…
Q: A senior accounting major at Midsouth State University has job offers from four CPA firms. To…
A: The numerator degrees of freedom is 3. The denominator degrees of freedom is 15.
Q: 1. Are the mean rates of return different at the α=0.05 level of significance? Use technology to…
A: We have used the excel data analysis tool to run the ANOVA analysis.
Q: 3. An experiment is conducted to determine whether paced tutoring is less effective than intensive…
A: 3. The given values are n1=10,x¯1=42.79,s1=7.52,n2=12,x¯2=46.31,s2=6.44.
Q: # 3. A study regarding the relationship between age and the amount of pressure sales personnel feel…
A: age low medium high less than 25 20 18 22 25 up to 40 50 46 44 40 up to 60 58 63 59 60 and…
Q: Samples of starting annual salaries for individuals entering the public accounting and financial…
A: Given, Sample 1 : 50.2,58.8,56.6,58.2,54.2,55,50.9,59.5,57,51.9 Mean, x̄1 = 55.23 Standard…
Q: A newly installed automatic gate system was being tested to see if the number of failures in 1,000…
A: Solution: Entry Exit d= Entry -Exit (d-d) (d-d)2 44 48 -4 -2.125 4.515625 42 50 -8 -6.125…
Q: senior accounting major at Midsouth State University has job offers from four CPA firms. To explore…
A: Hello. Since your question has multiple parts, we will solve first 3sub parts question for you. If…
Q: Suppose an architectural firm specializing in the structural restoration and renovation of historic…
A: From the given information, μ=65σ=12.6n=81M=67.3 Type II Error: The type II error occurs if “fail to…
Q: A senior accounting major at Midsouth State University has job offers from four CPA firms. To…
A:
Q: The number of carbohydrates found in a random sample of fast-food entrees is listed. is there…
A: Solution To test is there sufficient evidence to conclude that the variance differs from 100. First…
Q: Do students reduce study time in classes where they achieve a higher midterm score? In a Journal of…
A: The question is about paired t test : Given : Total no. of randomly selected students ( n ) = 8…
Q: A newly installed automatic gate system was being tested to see if the number of failures in 1,000…
A: Note: Hey, since multiple subparts are posted, we will answer first three subparts according to our…
Q: In general, why does using a repeated-measures ANOVA increase statistical power compared to using a…
A: ANOVA: ANOVA compares two or more mean scores with each other to check whether there is any…
Q: Using a pooled sample estimator, o , assumes the two populations have O A. different means. O B. the…
A:
Q: A ski company in Vail owns two ski shops, one on the west side and one on the east side of Vail. Ski…
A: The claim is that there is a significant difference in sales dollars of hats between the west side…
Q: A ski company in Vail owns two ski shops, one on the west side and one on the east side of Vail. Ski…
A: Solution: Let x =East side shop and y =West side shop To find the mean and stadnard deviation for…
Step by step
Solved in 2 steps with 1 images
- In a large country, the proportion of fatal traffic accidents in which the diver had a high BAC (Blood Alcohol Consumption) is 35%. Suppose a random sample of 107 fatal traffic accidents in a certain region, 47 of them had a high BAC. Does this evidence suggest that the region has a higher proportion of fatal traffic accidents with a high BAC than the rest of the country, a=0.05 level of significance? Use the p value approachAmoung 198 smokers who underwent a "sustained care" program, 51 were no longer smoking after six months. Use a 0.05 significance level to test the claim that the rate of smoking cessation is greater with the sustained care program. P-vaule: 0.004The sales rep of a waterbed claims that 25% of the Filipino died because of cardiovascular diseases. A researcher wants to test this claim. A hospital record shows that out of a random sample of 200 dead patients, 55 patients died because of cardiovascular diseases. Does the data provide sufficient evidence to support the claim of the sales rep? Use 0.03 level of significance.
- A consumer group is investigating a producer of diet meals to examine if its prepackaged meals actually contain the advertised 6 ounces of protein in each package. Based on the following data, is there any evidence that themeals do not contain the advertised amount of protein? Run the appropriate test at a 5% level of significance. What is the p-value of the test?In a previous poll, 38% of adults with children under the age of 18 reported that their family ate dinner together seven nights. suppose that, in a more recent poll, 399 of 1099 adults with children under the age of 18 reported that their family ate dinner together seven nights a week. is there sufficient evidence that the proportion of families with children under the age of 18 who eat diner together seven nights a week has decreased? use the a=0.05 significance levelThe U.S. Bureau of Printing and Engraving is responsible for printing thiscountry’s paper money. The BPE has an impressively small frequency of printingerrors; only 0.5 percent of all bills are too flawed for circulation. What is theprobability that out of a batch of 1,000 bills. At least two are too flawed forcirculation?
- A random sample of n1 = 300 voters registered in the state of California showed that 143 voted in the last general election. A random sample of n2 = 216 registered voters in the state of Colorado showed that 130 voted in the most recent general election. Do these data indicate that the population proportion of voter turnout in Colorado is higher than that in California? Use a 5% level of significance.A recent survey showed that from a sample of 500 packages delivered by a Postal Service, 480 were delivered on time.b) The manager of the Postal Services claims that 98 percent of their mail are delivered on time. Test at the 1% significance level to determine whether the true proportion is less than 98 percent. Answer this using the T-distribution table ONLY. Question 2. In 2002, the average duration of incoming telephone calls to a furniture store was 9.4 minutes. The manager wants to perform a test to determine whether this average durationof incoming calls has changed. Twenty calls to the store was randomly selected and the mean duration was 10.2 minutes with standard deviation 4.8 minutes. Assuming that the duration of incoming telephone calls to a furniture store is normally distributed,a) Use a 1% level of significance to test whether the mean duration of incoming calls to the store had changed. Calculate using the Statistical T Distribution Table ONLY.In a previous poll, 37% of adults with children under the age of 18 reported that their family ate dinner together seven nights a week. Suppose that, in a more recent poll, 418 of 1183 adults with children under the age of 18 reported that their family ate dinner together seven nights a week. Is there sufficient evidence that the proportion of families with children under the age of 18 who eat dinner together seven nights a week has decreased? Use the α=0.05 significance level. Find the test statistic, z0. Find the p-value.
- In the past, 85% of a lawn-care service’s continue with the service the following year. Last year, theservice changed management. In a sample of 120 customers, 96 are going to continue using the servicenext year.a) Test the hypothesis (at the 5% level of significance) that the proportion of repeat customers haschanged? b) What is the p-value?A market research study hopes to determine if the average sales of house entertainment units will increase in a test market with the introduction of a new package. Sales recorded in a 32-day period for the old package and a 30-day period for the new package were as follows: What can be concluded at 2.5% significance level? Use the Ten Step Process. Level of Significance:___________________________________________________ Test Statistic:_________________________________________________________ Formula:_____________________________________________________________A random sample of 1100 potential voters was randomly divided into 2 groups. Group 1: 500 potential voters; no registration reminders sent; 248 registered to vote Group 2: 600 potential voters; registration reminders sent; 332 registered to vote Do these data support the claim that the proportion of voters who registered was greater in the group that received reminders than in the group that did not? Use a 1% level of significance.