The following table gives the US population (in thousands) from 1790 to 2010: 1790: 3929 1810: 7240 1830: 12866 1850: 23192 1870: 39818 1890: 62948 1910: 91972 1930: 122775 1950: 150697 1970: 203302 1990: 248710 2010: 308746 Enter the years into L, and the populations into L, (in the same order). Produce a scatterplot. Does the scatterplot seems to follow a line? Explain your thinking clearly
The following table gives the US population (in thousands) from 1790 to 2010: 1790: 3929 1810: 7240 1830: 12866 1850: 23192 1870: 39818 1890: 62948 1910: 91972 1930: 122775 1950: 150697 1970: 203302 1990: 248710 2010: 308746 Enter the years into L, and the populations into L, (in the same order). Produce a scatterplot. Does the scatterplot seems to follow a line? Explain your thinking clearly

Algebra & Trigonometry with Analytic Geometry
13th Edition
ISBN:9781133382119
Author:Swokowski
Publisher:Swokowski
Chapter10: Sequences, Series, And Probability
Section10.2: Arithmetic Sequences
Problem 68E

Related questions
Question
100%
Solve these 2 questions please
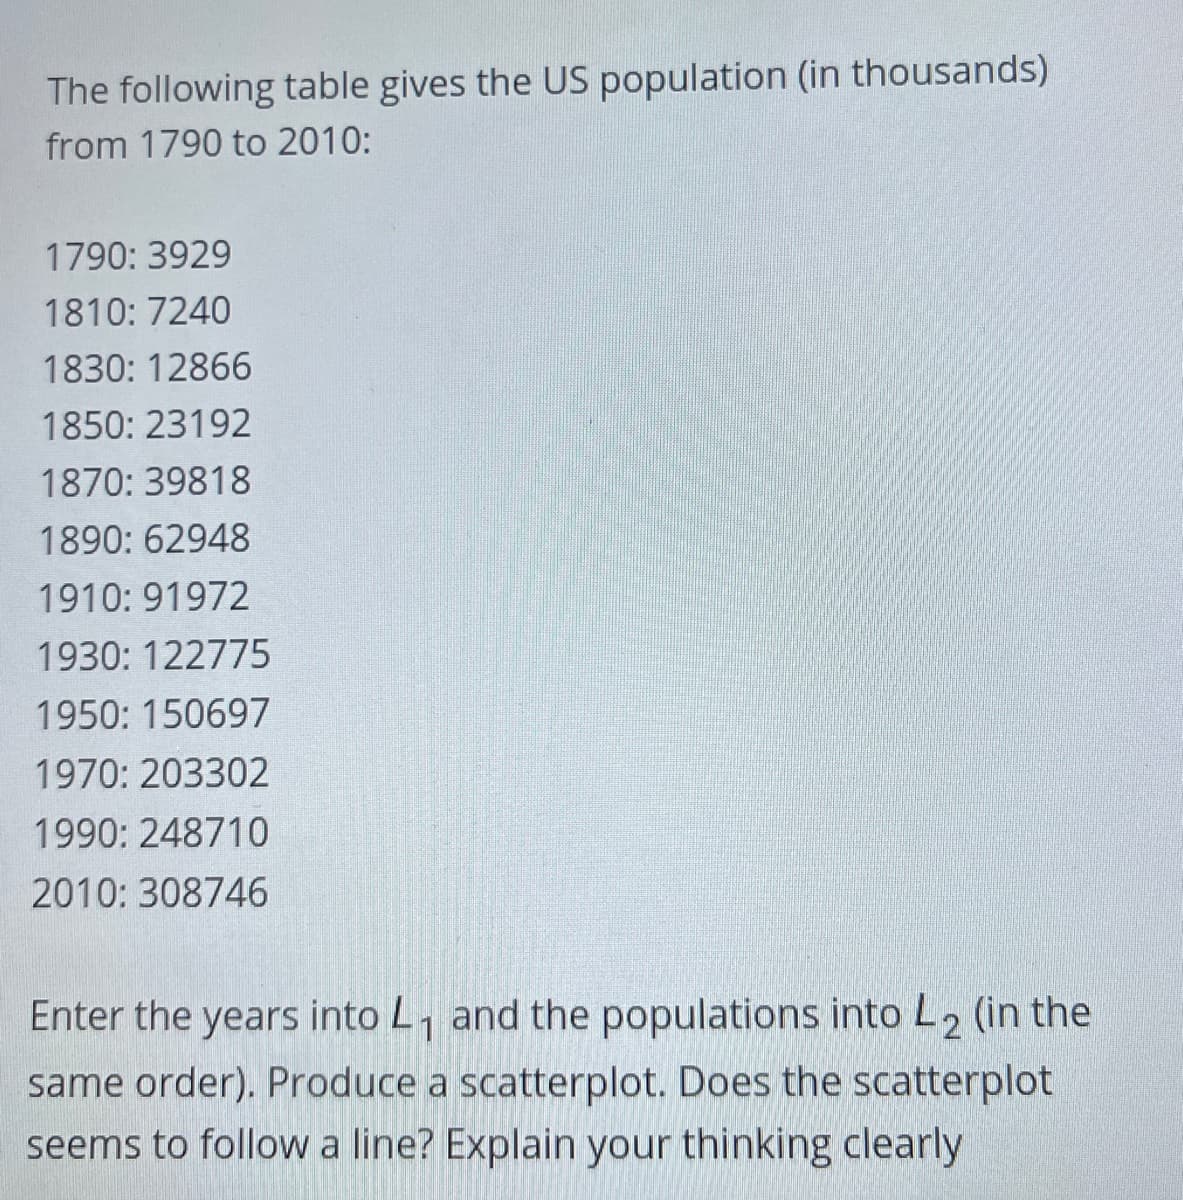
Transcribed Image Text:The following table gives the US population (in thousands)
from 1790 to 2010:
1790: 3929
1810: 7240
1830: 12866
1850: 23192
1870: 39818
1890: 62948
1910: 91972
1930: 122775
1950: 150697
1970: 203302
1990: 248710
2010: 308746
Enter the years into L, and the populations into L2 (in the
same order). Produce a scatterplot. Does the scatterplot
seems to follow a line? Explain your thinking clearly
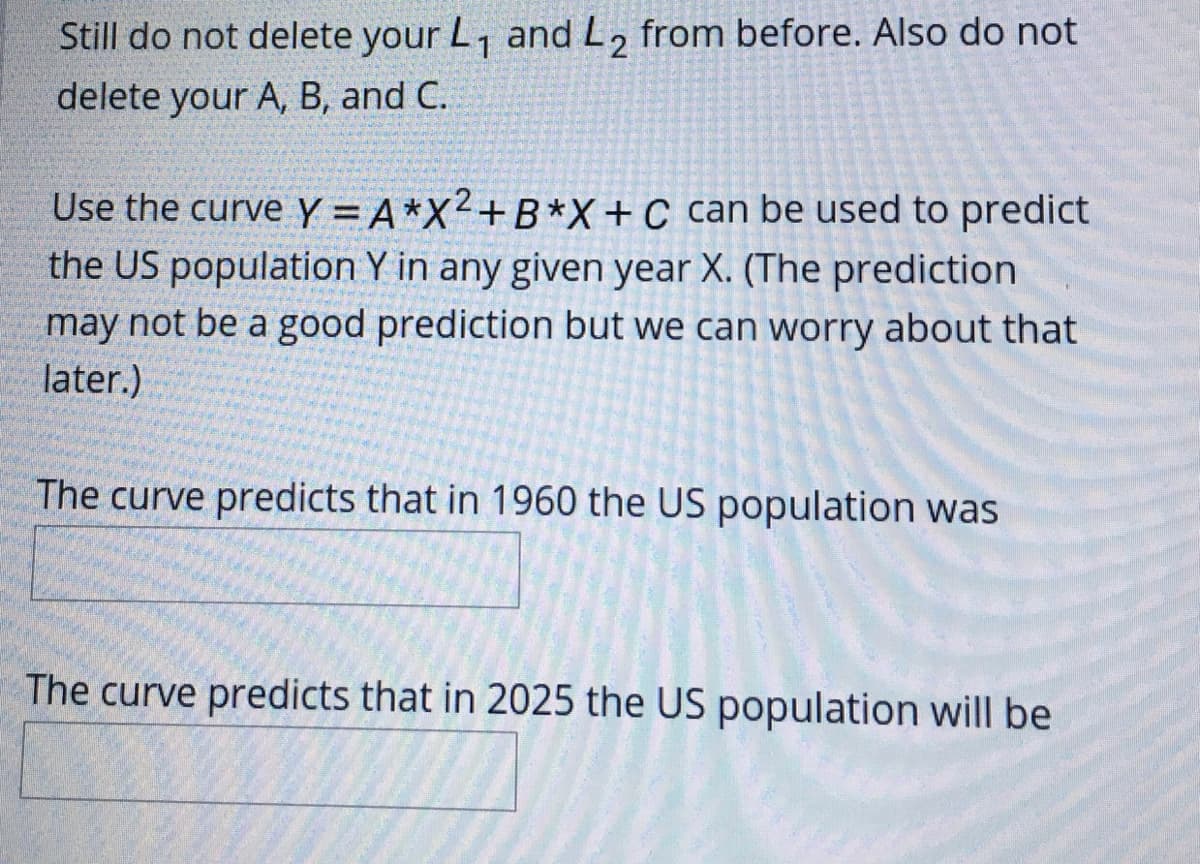
Transcribed Image Text:Still do not delete your L, and L2
from before. Also do not
delete your A, B, and C.
Use the curve Y = A*X²+B*X+C can be used to predict
the US population Y in any given year X. (The prediction
may not be a good prediction but we can worry about that
later.)
The curve predicts that in 1960 the US population was
The curve predicts that in 2025 the US population will be
Expert Solution
This question has been solved!
Explore an expertly crafted, step-by-step solution for a thorough understanding of key concepts.

Step by step
Solved in 2 steps with 3 images

Knowledge Booster


Learn more about
Need a deep-dive on the concept behind this application? Look no further. Learn more about this topic, statistics and related others by exploring similar questions and additional content below.Recommended textbooks for you
Algebra & Trigonometry with Analytic Geometry
Algebra
ISBN:
9781133382119
Author:
Swokowski
Publisher:
Cengage

Functions and Change: A Modeling Approach to Coll…
Algebra
ISBN:
9781337111348
Author:
Bruce Crauder, Benny Evans, Alan Noell
Publisher:
Cengage Learning
Algebra & Trigonometry with Analytic Geometry
Algebra
ISBN:
9781133382119
Author:
Swokowski
Publisher:
Cengage
Functions and Change: A Modeling Approach to Coll…
Algebra
ISBN:
9781337111348
Author:
Bruce Crauder, Benny Evans, Alan Noell
Publisher:
Cengage Learning