A national survey asked people, "How often do you eat out for dinner, instead of at home?" The frequencies were as follows. Complete parts (a) through (h). (a) Construct a relative frequency distribution of the data. Relative Response Frequency Never Response Frequency Rarely Never 347 Sometimes Rarely 577 Most of the time Sometimes 927 Always Most of the time 283 (Round to three decimal places as needed.) Always 59 (b) What percentage of respondents answered "Always"? (Round to one decimal place as needed.) (c) What percentage of respondents answered "Never" or "Rarely"? % (Round to one decimal place as needed.) (d) Construct a frequency bar graph. Choose the correct answer below. A. 1000- 750- 500- 250- n. Frequency
A national survey asked people, "How often do you eat out for dinner, instead of at home?" The frequencies were as follows. Complete parts (a) through (h). (a) Construct a relative frequency distribution of the data. Relative Response Frequency Never Response Frequency Rarely Never 347 Sometimes Rarely 577 Most of the time Sometimes 927 Always Most of the time 283 (Round to three decimal places as needed.) Always 59 (b) What percentage of respondents answered "Always"? (Round to one decimal place as needed.) (c) What percentage of respondents answered "Never" or "Rarely"? % (Round to one decimal place as needed.) (d) Construct a frequency bar graph. Choose the correct answer below. A. 1000- 750- 500- 250- n. Frequency

Glencoe Algebra 1, Student Edition, 9780079039897, 0079039898, 2018
18th Edition
ISBN:9780079039897
Author:Carter
Publisher:Carter
Chapter10: Statistics
Section10.6: Summarizing Categorical Data
Problem 23PPS

Related questions
Question
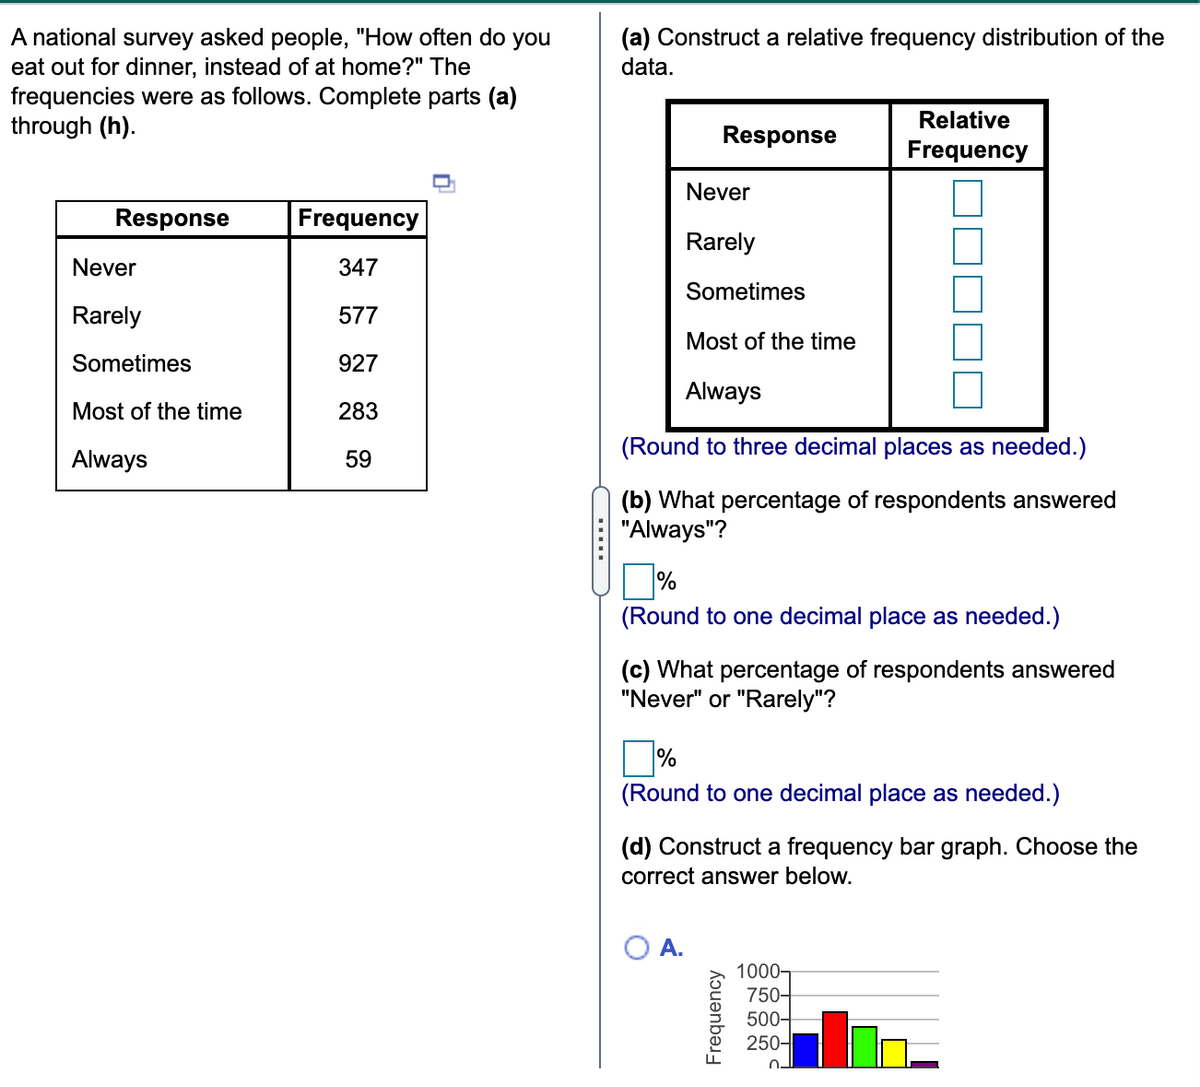
Transcribed Image Text:A national survey asked people, "How often do you
eat out for dinner, instead of at home?" The
frequencies were as follows. Complete parts (a)
through (h).
(a) Construct a relative frequency distribution of the
data.
Relative
Response
Frequency
Never
Response
Frequency
Rarely
Never
347
Sometimes
Rarely
577
Most of the time
Sometimes
927
Always
Most of the time
283
(Round to three decimal places as needed.)
Always
59
(b) What percentage of respondents answered
"Always"?
%
(Round to one decimal place as needed.)
(c) What percentage of respondents answered
"Never" or "Rarely"?
(Round to one decimal place as needed.)
(d) Construct a frequency bar graph. Choose the
correct answer below.
A.
1000-
750-
500-
250-
Frequency
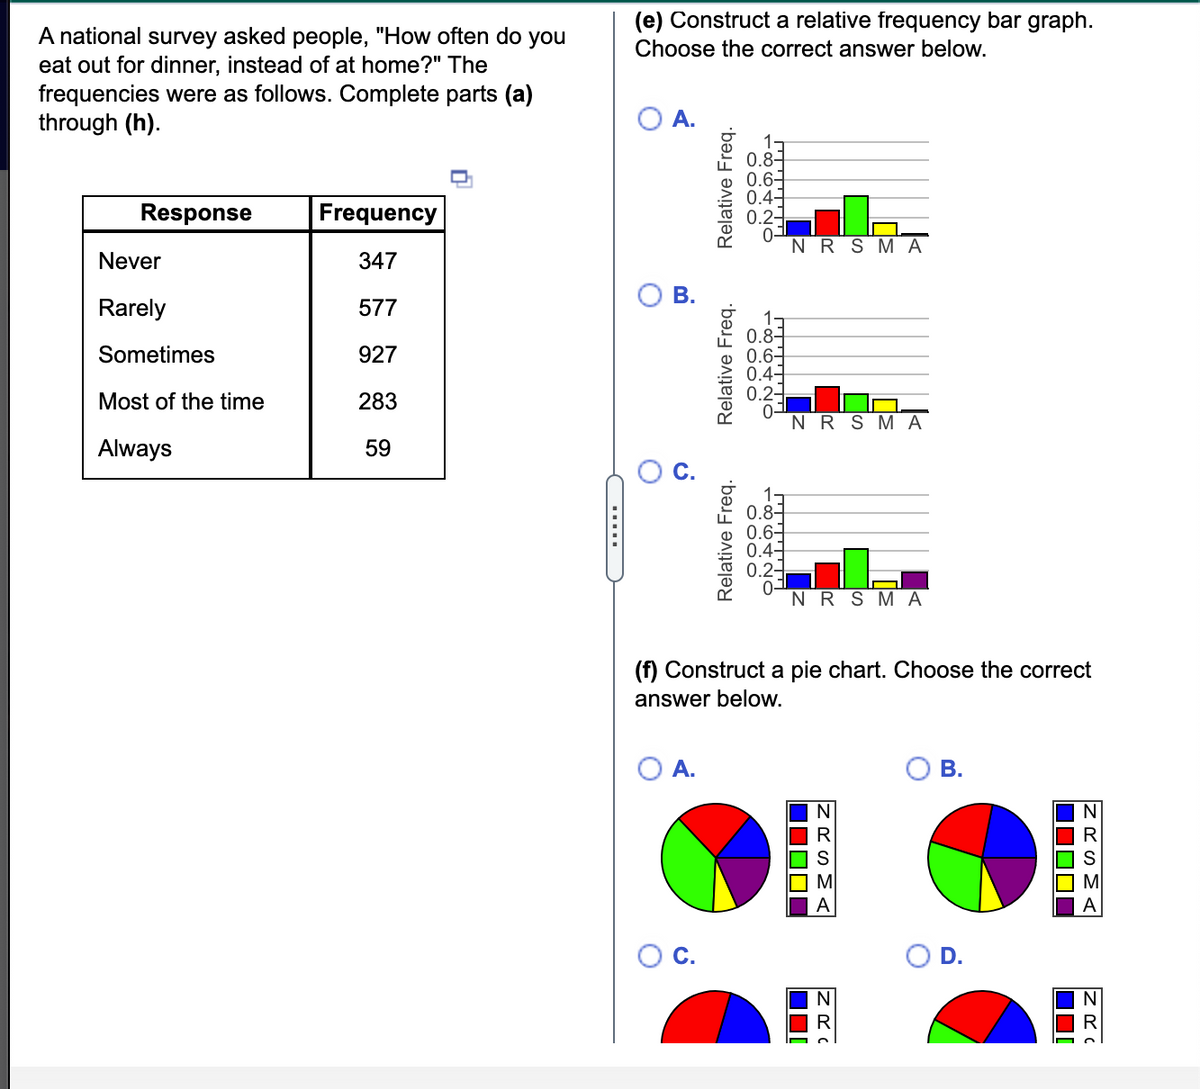
Transcribed Image Text:(e) Construct a relative frequency bar graph.
A national survey asked people, "How often do you
eat out for dinner, instead of at home?" The
frequencies were as follows. Complete parts (a)
through (h).
Choose the correct answer below.
0.8-
0.6-
0.41
0.2-
0-
N R SM A
Response
Frequency
Never
347
Rarely
577
0.8-
0.6
0.4
0.24
0-
N RSMA
Sometimes
927
Most of the time
283
Always
59
1-
0.8-
0.6-
0.44
0.2-
N R SMA
(f) Construct a pie chart. Choose the correct
answer below.
O A.
В.
N
Oc.
D.
N
ZRSM
ZRSMA
Relative Freq.
C.
Relative Freq.
B.
.....
Expert Solution
This question has been solved!
Explore an expertly crafted, step-by-step solution for a thorough understanding of key concepts.

This is a popular solution!

Trending now
This is a popular solution!

Step by step
Solved in 3 steps with 1 images

Recommended textbooks for you
Glencoe Algebra 1, Student Edition, 9780079039897…
Algebra
ISBN:
9780079039897
Author:
Carter
Publisher:
McGraw Hill
Glencoe Algebra 1, Student Edition, 9780079039897…
Algebra
ISBN:
9780079039897
Author:
Carter
Publisher:
McGraw Hill