A new virus has taken root in a country. Government officials are reporting that 14.8% of the population is currently infected with the virus. However, epidemiologists across the country claim to be observing a much higher infection rate. It was found that 186 people out of a randomly selected sample of 1100 people from around the country were infected with the virus. Use the critical value method to determine if the sample data support the epidemiologists' supposition that the true rate of infection in the country is higher than 14.8%. Let a = 0.05. State the null and alternative hypothesis for this test. Ho:? H1: ? v Determine if this test is left-tailed, right-tailed, or two-tailed. O two-tailed O left-tailed O right-tailed Should the standard normal (z) distribution or Student's (t) distribution be used for this test? O The standard normal (z) distribution should be used O The Student's t distribution should be used Determine the critical value(s) for this hypothesis test. Round the solution(s) to two decimal places. If more than one critical value exists, enter the solutions using a comma-separated list. Determine the test statistic. Round the solution to two decimal places. Determine the appropriate conclusion for this hypothesis test. O The sample data do not provide sufficient evidence to reject the epidemiologists' claim (alternative hypothesis) that the infection rate is higher than 14.8% and thus we concluded that the infection rate of the virus is likely greater than 14.8%. O The sample data do not provide sufficient evidence to reject the government's claim (null hypothesis)that the infection rate of the virus is 14.8% and thus we conclude that the infection rate
A new virus has taken root in a country. Government officials are reporting that 14.8% of the population is currently infected with the virus. However, epidemiologists across the country claim to be observing a much higher infection rate. It was found that 186 people out of a randomly selected sample of 1100 people from around the country were infected with the virus. Use the critical value method to determine if the sample data support the epidemiologists' supposition that the true rate of infection in the country is higher than 14.8%. Let a = 0.05. State the null and alternative hypothesis for this test. Ho:? H1: ? v Determine if this test is left-tailed, right-tailed, or two-tailed. O two-tailed O left-tailed O right-tailed Should the standard normal (z) distribution or Student's (t) distribution be used for this test? O The standard normal (z) distribution should be used O The Student's t distribution should be used Determine the critical value(s) for this hypothesis test. Round the solution(s) to two decimal places. If more than one critical value exists, enter the solutions using a comma-separated list. Determine the test statistic. Round the solution to two decimal places. Determine the appropriate conclusion for this hypothesis test. O The sample data do not provide sufficient evidence to reject the epidemiologists' claim (alternative hypothesis) that the infection rate is higher than 14.8% and thus we concluded that the infection rate of the virus is likely greater than 14.8%. O The sample data do not provide sufficient evidence to reject the government's claim (null hypothesis)that the infection rate of the virus is 14.8% and thus we conclude that the infection rate

College Algebra (MindTap Course List)
12th Edition
ISBN:9781305652231
Author:R. David Gustafson, Jeff Hughes
Publisher:R. David Gustafson, Jeff Hughes
Chapter8: Sequences, Series, And Probability
Section8.7: Probability
Problem 58E: What is meant by the sample space of an experiment?

Related questions
Question
100%
#33). Both pictures are the same problem. Need help with the whole equation.
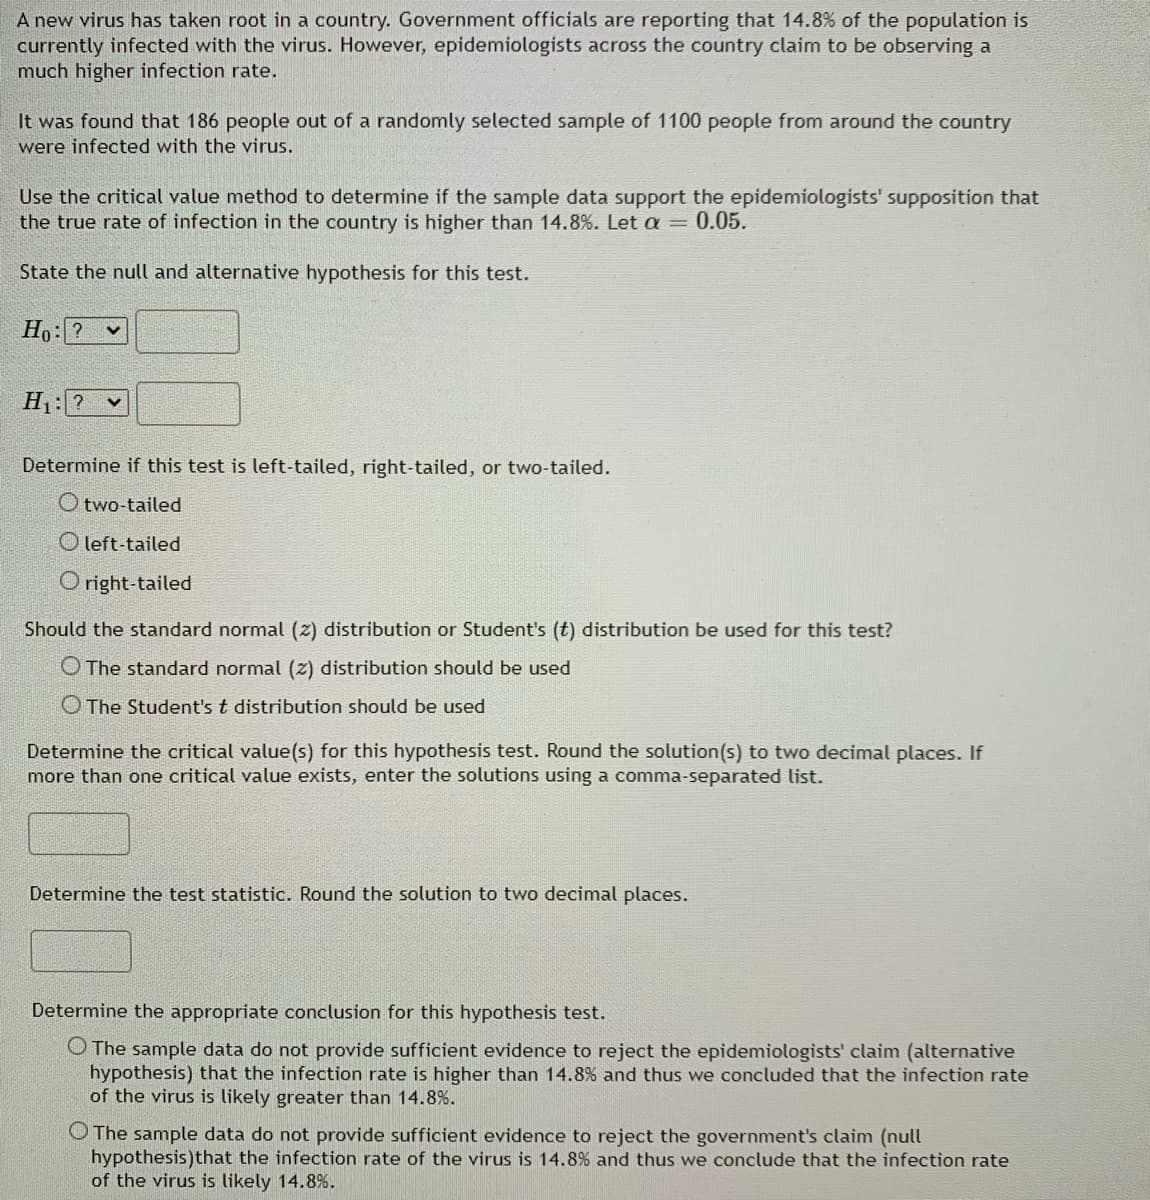
Transcribed Image Text:A new virus has taken root in a country. Government officials are reporting that 14.8% of the population is
currently infected with the virus. However, epidemiologists across the country claim to be observing a
much higher infection rate.
It was found that 186 people out of a randomly selected sample of 1100 people from around the country
were infected with the virus.
Use the critical value method to determine if the sample data support the epidemiologists' supposition that
the true rate of infection in the country is higher than 14.8%. Let a = 0.05.
State the null and alternative hypothesis for this test.
Ho:?
H1: ? v
Determine if this test is left-tailed, right-tailed, or two-tailed.
O two-tailed
O left-tailed
O right-tailed
Should the standard normal (2) distribution or Student's (t) distribution be used for this test?
O The standard normal (z) distribution should be used
O The Student's t distribution should be used
Determine the critical value(s) for this hypothesis test. Round the solution(s) to two decimal places. If
more than one critical value exists, enter the solutions using a comma-separated list.
Determine the test statistic. Round the solution to two decimal places.
Determine the appropriate conclusion for this hypothesis test.
O The sample data do not provide sufficient evidence to reject the epidemiologists' claim (alternative
hypothesis) that the infection rate is higher than 14.8% and thus we concluded that the infection rate
of the virus is likely greater than 14.8%.
O The sample data do not provide sufficient evidence to reject the government's claim (null
hypothesis)that the infection rate of the virus is 14.8% and thus we conclude that the infection rate
of the virus is likely 14.8%.
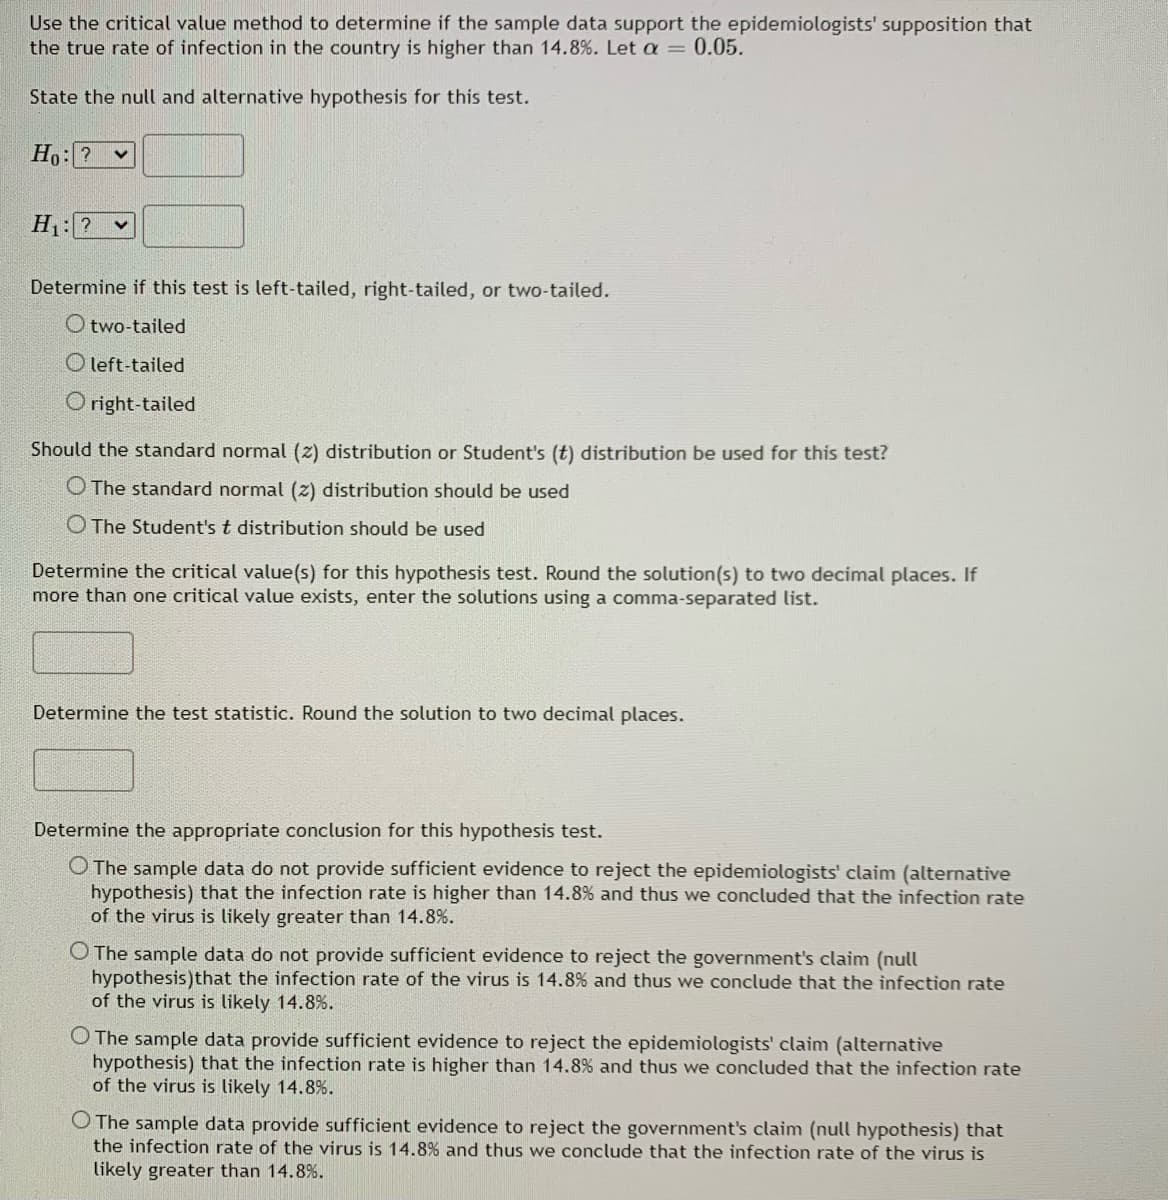
Transcribed Image Text:Use the critical value method to determine if the sample data support the epidemiologists' supposition that
the true rate of infection in the country is higher than 14.8%. Let a = 0.05.
State the null and alternative hypothesis for this test.
Ho: ? v
H1: ? v
Determine if this test is left-tailed, right-tailed, or two-tailed.
O two-tailed
O left-tailed
O right-tailed
Should the standard normal (z) distribution or Student's (t) distribution be used for this test?
O The standard normal (z) distribution should be used
O The Student's t distribution should be used
Determine the critical value(s) for this hypothesis test. Round the solution(s) to two decimal places. If
more than one critical value exists, enter the solutions using a comma-separated list.
Determine the test statistic. Round the solution to two decimal places.
Determine the appropriate conclusion for this hypothesis test.
O The sample data do not provide sufficient evidence to reject the epidemiologists' claim (alternative
hypothesis) that the infection rate is higher than 14.8% and thus we concluded that the infection rate
of the virus is likely greater than 14.8%.
O The sample data do not provide sufficient evidence to reject the government's claim (null
hypothesis)that the infection rate of the virus is 14.8% and thus we conclude that the infection rate
of the virus is likely 14.8%.
O The sample data provide sufficient evidence to reject the epidemiologists' claim (alternative
hypothesis) that the infection rate is higher than 14.8% and thus we concluded that the infection rate
of the virus is likely 14.8%.
O The sample data provide sufficient evidence to reject the government's claim (null hypothesis) that
the infection rate of the virus is 14.8% and thus we conclude that the infection rate of the virus is
likely greater than 14.8%.
Expert Solution
This question has been solved!
Explore an expertly crafted, step-by-step solution for a thorough understanding of key concepts.

This is a popular solution!

Trending now
This is a popular solution!

Step by step
Solved in 2 steps with 1 images

Recommended textbooks for you
College Algebra (MindTap Course List)
Algebra
ISBN:
9781305652231
Author:
R. David Gustafson, Jeff Hughes
Publisher:
Cengage Learning
College Algebra (MindTap Course List)
Algebra
ISBN:
9781305652231
Author:
R. David Gustafson, Jeff Hughes
Publisher:
Cengage Learning