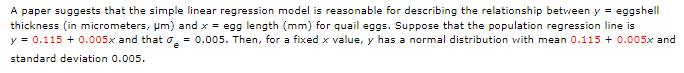
A paper suggests that the simple linear regression model is reasonable for describing the relationship between y = eggshell thickness (in micrometers, Pm) and x = egg length (mm) for quail eggs. Suppose that the population regression line is y = 0.115 + 0.005x and that o = 0.005. Then, for a fixed x value, y has a normal distribution with mean 0.115 + 0.005x and standard deviation 0.005.
A paper suggests that the simple linear regression model is reasonable for describing the relationship between y = eggshell thickness (in micrometers, Pm) and x = egg length (mm) for quail eggs. Suppose that the population regression line is y = 0.115 + 0.005x and that o = 0.005. Then, for a fixed x value, y has a normal distribution with mean 0.115 + 0.005x and standard deviation 0.005.

Glencoe Algebra 1, Student Edition, 9780079039897, 0079039898, 2018
18th Edition
ISBN:9780079039897
Author:Carter
Publisher:Carter
Chapter4: Equations Of Linear Functions
Section4.6: Regression And Median-fit Lines
Problem 4GP

Related questions
Question
Transcribed Image Text:A paper suggests that the simple linear regression model is reasonable for describing the relationship between y = eggshell
thickness (in micrometers, Pm) and x = egg length (mm) for quail eggs. Suppose that the population regression line is
y = 0.115 + 0.005x and that o = 0.005. Then, for a fixed x value, y has a normal distribution with mean 0.115 + 0.005x and
standard deviation 0.005.
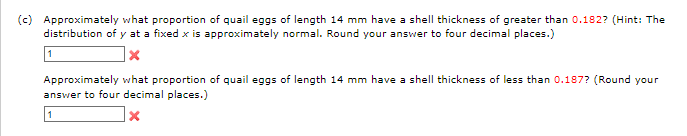
Transcribed Image Text:(c) Approximately what proportion of quail eggs of length 14 mm have a shell thickness of greater than 0.182? (Hint: The
distribution of y at a fixed x is approximately normal. Round your answer to four decimal places.)
1
Approximately what proportion of quail eggs of length 14 mm have a shell thickness of less than 0.187? (Round your
answer to four decimal places.)
1
Expert Solution
This question has been solved!
Explore an expertly crafted, step-by-step solution for a thorough understanding of key concepts.

This is a popular solution!

Trending now
This is a popular solution!

Step by step
Solved in 2 steps with 2 images

Recommended textbooks for you
Glencoe Algebra 1, Student Edition, 9780079039897…
Algebra
ISBN:
9780079039897
Author:
Carter
Publisher:
McGraw Hill
Glencoe Algebra 1, Student Edition, 9780079039897…
Algebra
ISBN:
9780079039897
Author:
Carter
Publisher:
McGraw Hill