A personnel director in a particular state claims that the mean annual income is greater in one of the state's counties (county A) than it is in another county (county B). In County A, a random sample of 6 residents has a mean annual income of $41,400 and a standard deviation of $8400. In County B, a random sample of 8 residents has a mean annual income of $39,800 and a standard deviation of $5200. At a = 0.10, answer parts (a) through (e). Assume the population variances are not equal. convenient, use technology to solve the problem. (a) Identify the claim and state Ho and H. Which is the correct claim below? O A. "The mean annual income in county A is less than county B." O B. "The mean annual incomes in counties A and B are not equal." OC. "The mean annual incomes in counties A and B are equal." O D. "The mean annual income in county A is greater than county B." What are Ho and H,? The null hypothesis, Ho, is The alternative hypothesis, Ha. is Which hypothesis is the claim? O The null hypothesis, Ho O The alternative hypothesis, Ha (b) Find the critical value(s) and identify the rejection region(s). Enter the critical value(s) below. (Type an integer or decimal rounded to three decimal places as needed. Use a comma to separate answers as needed.) Select the correct rejection region(s) below. OA -toto OC. t< -to O D. t>h
A personnel director in a particular state claims that the mean annual income is greater in one of the state's counties (county A) than it is in another county (county B). In County A, a random sample of 6 residents has a mean annual income of $41,400 and a standard deviation of $8400. In County B, a random sample of 8 residents has a mean annual income of $39,800 and a standard deviation of $5200. At a = 0.10, answer parts (a) through (e). Assume the population variances are not equal. convenient, use technology to solve the problem. (a) Identify the claim and state Ho and H. Which is the correct claim below? O A. "The mean annual income in county A is less than county B." O B. "The mean annual incomes in counties A and B are not equal." OC. "The mean annual incomes in counties A and B are equal." O D. "The mean annual income in county A is greater than county B." What are Ho and H,? The null hypothesis, Ho, is The alternative hypothesis, Ha. is Which hypothesis is the claim? O The null hypothesis, Ho O The alternative hypothesis, Ha (b) Find the critical value(s) and identify the rejection region(s). Enter the critical value(s) below. (Type an integer or decimal rounded to three decimal places as needed. Use a comma to separate answers as needed.) Select the correct rejection region(s) below. OA -toto OC. t< -to O D. t>h

Glencoe Algebra 1, Student Edition, 9780079039897, 0079039898, 2018
18th Edition
ISBN:9780079039897
Author:Carter
Publisher:Carter
Chapter10: Statistics
Section10.4: Distributions Of Data
Problem 19PFA

Related questions

Question
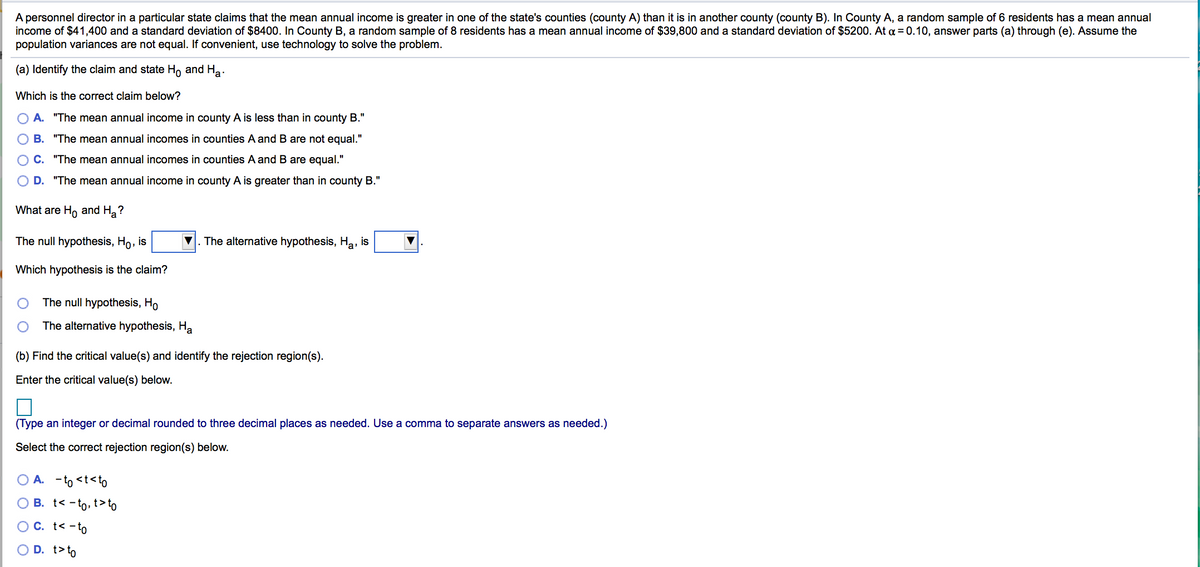
Transcribed Image Text:A personnel director in a particular state claims that the mean annual income is greater in one of the state's counties (county A) than it is in another county (county B). In County A, a random sample of 6 residents has a mean annual
income of $41,400 and a standard deviation of $8400. In County B, a random sample of 8 residents has a mean annual income of $39,800 and a standard deviation of $5200. At a = 0.10, answer parts (a) through (e). Assume the
population variances are not equal. If convenient, use technology to solve the problem.
(a) Identify the claim and state Ho and Ha.
Which is the correct claim below?
A. "The mean annual income in county A is less than in county B."
B. "The mean annual incomes in counties A and B are not equal."
C. "The mean annual incomes in counties A and B are equal."
D. "The mean annual income in county A is greater than in county B."
What are H, and Ha?
The null hypothesis, Ho, is
The alternative hypothesis, Ha, is
Which hypothesis is the claim?
The null hypothesis, Ho
The alternative hypothesis, Ha
(b) Find the critical value(s) and identify the rejection region(s).
Enter the critical value(s) below.
(Type an integer or decimal rounded to three decimal places as needed. Use a comma to separate answers as needed.)
Select the correct rejection region(s) below.
A. -to <t<to
B. t< - to, t>to
O C. t< -to
O D. t>to
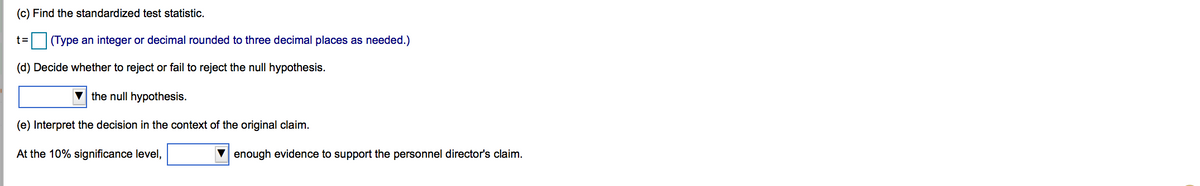
Transcribed Image Text:(c) Find the standardized test statistic.
t3=
(Type an integer or decimal rounded to three decimal places as needed.)
(d) Decide whether to reject or fail to reject the null hypothesis.
V the null hypothesis.
(e) Interpret the decision in the context of the original claim.
At the 10% significance level,
enough evidence to support the personnel director's claim.
Expert Solution
This question has been solved!
Explore an expertly crafted, step-by-step solution for a thorough understanding of key concepts.

This is a popular solution!

Trending now
This is a popular solution!

Step by step
Solved in 2 steps

Knowledge Booster


Learn more about
Need a deep-dive on the concept behind this application? Look no further. Learn more about this topic, statistics and related others by exploring similar questions and additional content below.Recommended textbooks for you
Glencoe Algebra 1, Student Edition, 9780079039897…
Algebra
ISBN:
9780079039897
Author:
Carter
Publisher:
McGraw Hill
Glencoe Algebra 1, Student Edition, 9780079039897…
Algebra
ISBN:
9780079039897
Author:
Carter
Publisher:
McGraw Hill