A pharmaceutical company is about to launch a new manufacturing process in addition to the existing one. The quality control manager believes that the new method results in a different variation in the weights of the capsules. To verify the claim, the samples from each production line were obtained and the results are below (in mg): Production Line 1: 98.9 100.7 104.7 101.9 101.6 101 101 98.8 99.4 100.3 (Note: The average and the standard deviation of the data are respectively 100.83 mg and 1.731 mg.) Production Line 2: 100.4 102 97.6 99.9 100 102.5 100.4 98.6 97.5 99.1 100.8 99.3 99.5 101.6 99.1 99 98.6 (Note: The average and the standard deviation of the data are respectively 99.76 mg and 1.416 mg.) Use a 1% significance level to test the claim that the standard deviation of the capsule weights in the production line 1 is greater than the standard deviation of the capsule weights in the production line 2. If normality plots are not provided assume that the samples are from normal populations.
A pharmaceutical company is about to launch a new manufacturing process in addition to the existing one. The quality control manager believes that the new method results in a different variation in the weights of the capsules. To verify the claim, the samples from each production line were obtained and the results are below (in mg): Production Line 1: 98.9 100.7 104.7 101.9 101.6 101 101 98.8 99.4 100.3 (Note: The average and the standard deviation of the data are respectively 100.83 mg and 1.731 mg.) Production Line 2: 100.4 102 97.6 99.9 100 102.5 100.4 98.6 97.5 99.1 100.8 99.3 99.5 101.6 99.1 99 98.6 (Note: The average and the standard deviation of the data are respectively 99.76 mg and 1.416 mg.) Use a 1% significance level to test the claim that the standard deviation of the capsule weights in the production line 1 is greater than the standard deviation of the capsule weights in the production line 2. If normality plots are not provided assume that the samples are from normal populations.

MATLAB: An Introduction with Applications
6th Edition
ISBN:9781119256830
Author:Amos Gilat
Publisher:Amos Gilat
Chapter1: Starting With Matlab
Section: Chapter Questions
Problem 1P

Related questions
Question
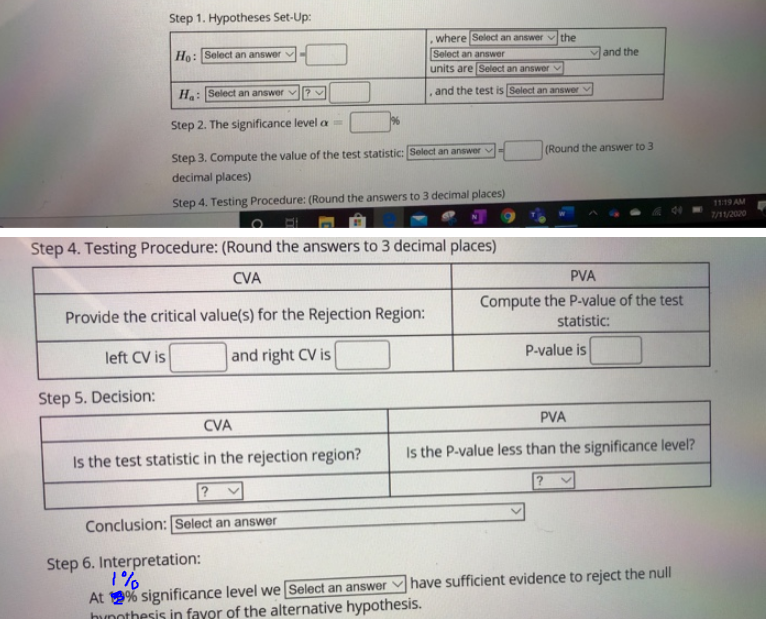
Transcribed Image Text:Step 1. Hypotheses Set-Up:
Ho: Select an answer
Ha: Select an answer
Step 2. The significance level =
Provide the critical value(s) for the Rejection Region:
left CV is
and right CV is
Step 5. Decision:
where Select an answer the
Select an answer
units are Select an answer
Step 3. Compute the value of the test statistic: Select an answer
decimal places)
Step 4. Testing Procedure: (Round the answers to 3 decimal places)
CVA
Is the test statistic in the rejection region?
?
Conclusion: Select an answer
.
and the test is Select an answer
Step 4. Testing Procedure: (Round the answers to 3 decimal places)
CVA
Step 6. Interpretation:
1%
At % significance level we [Select an answer
hypothesis in favor of the alternative hypothesis.
E
and the
(Round the answer to 3
PVA
Compute the P-value of the test
statistic:
P-value is
PVA
Is the P-value less than the significance level?
have sufficient evidence to reject the null
11:19 AM
7/11/2020
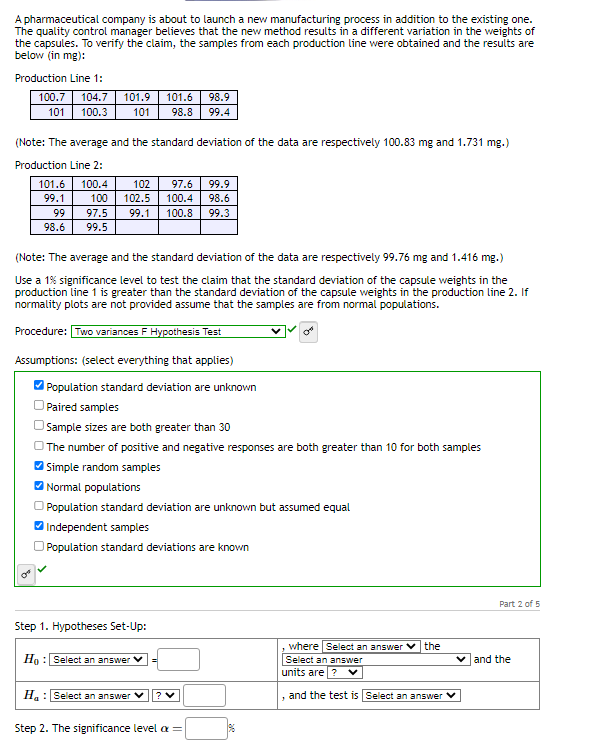
Transcribed Image Text:A pharmaceutical company is about to launch a new manufacturing process in addition to the existing one.
The quality control manager believes that the new method results in a different variation in the weights of
the capsules. To verify the claim, the samples from each production line were obtained and the results are
below (in mg):
Production Line 1:
100.7 104.7
101 100.3
101.9 101.6
101 98.8
99
98.6
(Note: The average and the standard deviation of the data are respectively 100.83 mg and 1.731 mg.)
Production Line 2:
101.6 100.4
99.1
100
97.5
99.5
102 97.6 99.9
102.5 100.4 98.6
99.1 100.8 99.3
(Note: The average and the standard deviation of the data are respectively 99.76 mg and 1.416 mg.)
Use a 1% significance level to test the claim that the standard deviation of the capsule weights in the
production line 1 is greater than the standard deviation of the capsule weights in the production line 2. If
normality plots are not provided assume that the samples are from normal populations.
Procedure: Two variances F Hypothesis Test
Assumptions: (select everything that applies)
Population standard deviation are unknown
Paired samples
Sample sizes are both greater than 30
The number of positive and negative responses are both greater than 10 for both samples
✔Simple random samples
✔Normal populations
98.9
99.4
Population standard deviation are unknown but assumed equal
Independent samples
Population standard deviations are known
Step 1. Hypotheses Set-Up:
Ho: Select an answer
H: Select an answer
? V
Step 2. The significance level ax =
%
the
, where Select an answer
Select an answer
units are ? V
and the test is Select an answer ✓
Part 2 of 5
✓ and the
Expert Solution
Step 1: Given information:
We have to test the claim that the standard deviation of weight of capsules in production line 1 is greater than the standard deviation of weight of capsules in production line 2.
The sample information for production line 1 is given as:
Sample size: format('truetype')%3Bfont-weight%3Anormal%3Bfont-style%3Anormal%3B%7D%3C%2Fstyle%3E%3C%2Fdefs%3E%3Ctext%20font-family%3D%22Arial%22%20font-size%3D%2216%22%20font-style%3D%22italic%22%20text-anchor%3D%22middle%22%20x%3D%224.5%22%20y%3D%2216%22%3En%3C%2Ftext%3E%3Ctext%20font-family%3D%22Arial%22%20font-size%3D%2212%22%20text-anchor%3D%22middle%22%20x%3D%2213.5%22%20y%3D%2221%22%3E1%3C%2Ftext%3E%3Ctext%20font-family%3D%22math17f39f8317fbdb1988ef4c628eb%22%20font-size%3D%2216%22%20text-anchor%3D%22middle%22%20x%3D%2225.5%22%20y%3D%2216%22%3E%3D%3C%2Ftext%3E%3Ctext%20font-family%3D%22Arial%22%20font-size%3D%2216%22%20text-anchor%3D%22middle%22%20x%3D%2243.5%22%20y%3D%2216%22%3E10%3C%2Ftext%3E%3C%2Fsvg%3E)
Sample standard deviation: format('truetype')%3Bfont-weight%3Anormal%3Bfont-style%3Anormal%3B%7D%3C%2Fstyle%3E%3C%2Fdefs%3E%3Ctext%20font-family%3D%22Arial%22%20font-size%3D%2216%22%20font-style%3D%22italic%22%20text-anchor%3D%22middle%22%20x%3D%224.5%22%20y%3D%2216%22%3Es%3C%2Ftext%3E%3Ctext%20font-family%3D%22Arial%22%20font-size%3D%2212%22%20text-anchor%3D%22middle%22%20x%3D%2212.5%22%20y%3D%2221%22%3E1%3C%2Ftext%3E%3Ctext%20font-family%3D%22math11824c643d1feb4da18b28ed527%22%20font-size%3D%2216%22%20text-anchor%3D%22middle%22%20x%3D%2224.5%22%20y%3D%2216%22%3E%3D%3C%2Ftext%3E%3Ctext%20font-family%3D%22Arial%22%20font-size%3D%2216%22%20text-anchor%3D%22middle%22%20x%3D%2237.5%22%20y%3D%2216%22%3E1%3C%2Ftext%3E%3Ctext%20font-family%3D%22math11824c643d1feb4da18b28ed527%22%20font-size%3D%2216%22%20text-anchor%3D%22middle%22%20x%3D%2244.5%22%20y%3D%2216%22%3E.%3C%2Ftext%3E%3Ctext%20font-family%3D%22Arial%22%20font-size%3D%2216%22%20text-anchor%3D%22middle%22%20x%3D%2260.5%22%20y%3D%2216%22%3E731%3C%2Ftext%3E%3C%2Fsvg%3E)
The sample information for production line 2 is given as:
Sample size: format('truetype')%3Bfont-weight%3Anormal%3Bfont-style%3Anormal%3B%7D%3C%2Fstyle%3E%3C%2Fdefs%3E%3Ctext%20font-family%3D%22Arial%22%20font-size%3D%2216%22%20font-style%3D%22italic%22%20text-anchor%3D%22middle%22%20x%3D%224.5%22%20y%3D%2216%22%3En%3C%2Ftext%3E%3Ctext%20font-family%3D%22Arial%22%20font-size%3D%2212%22%20text-anchor%3D%22middle%22%20x%3D%2213.5%22%20y%3D%2221%22%3E2%3C%2Ftext%3E%3Ctext%20font-family%3D%22math17f39f8317fbdb1988ef4c628eb%22%20font-size%3D%2216%22%20text-anchor%3D%22middle%22%20x%3D%2225.5%22%20y%3D%2216%22%3E%3D%3C%2Ftext%3E%3Ctext%20font-family%3D%22Arial%22%20font-size%3D%2216%22%20text-anchor%3D%22middle%22%20x%3D%2243.5%22%20y%3D%2216%22%3E17%3C%2Ftext%3E%3C%2Fsvg%3E)
Sample standard deviation: format('truetype')%3Bfont-weight%3Anormal%3Bfont-style%3Anormal%3B%7D%3C%2Fstyle%3E%3C%2Fdefs%3E%3Ctext%20font-family%3D%22Arial%22%20font-size%3D%2216%22%20font-style%3D%22italic%22%20text-anchor%3D%22middle%22%20x%3D%224.5%22%20y%3D%2216%22%3Es%3C%2Ftext%3E%3Ctext%20font-family%3D%22Arial%22%20font-size%3D%2212%22%20text-anchor%3D%22middle%22%20x%3D%2212.5%22%20y%3D%2221%22%3E2%3C%2Ftext%3E%3Ctext%20font-family%3D%22math11824c643d1feb4da18b28ed527%22%20font-size%3D%2216%22%20text-anchor%3D%22middle%22%20x%3D%2224.5%22%20y%3D%2216%22%3E%3D%3C%2Ftext%3E%3Ctext%20font-family%3D%22Arial%22%20font-size%3D%2216%22%20text-anchor%3D%22middle%22%20x%3D%2237.5%22%20y%3D%2216%22%3E1%3C%2Ftext%3E%3Ctext%20font-family%3D%22math11824c643d1feb4da18b28ed527%22%20font-size%3D%2216%22%20text-anchor%3D%22middle%22%20x%3D%2244.5%22%20y%3D%2216%22%3E.%3C%2Ftext%3E%3Ctext%20font-family%3D%22Arial%22%20font-size%3D%2216%22%20text-anchor%3D%22middle%22%20x%3D%2260.5%22%20y%3D%2216%22%3E416%3C%2Ftext%3E%3C%2Fsvg%3E)

Step by step
Solved in 8 steps with 24 images

Recommended textbooks for you
MATLAB: An Introduction with Applications
Statistics
ISBN:
9781119256830
Author:
Amos Gilat
Publisher:
John Wiley & Sons Inc

Probability and Statistics for Engineering and th…
Statistics
ISBN:
9781305251809
Author:
Jay L. Devore
Publisher:
Cengage Learning

Statistics for The Behavioral Sciences (MindTap C…
Statistics
ISBN:
9781305504912
Author:
Frederick J Gravetter, Larry B. Wallnau
Publisher:
Cengage Learning
MATLAB: An Introduction with Applications
Statistics
ISBN:
9781119256830
Author:
Amos Gilat
Publisher:
John Wiley & Sons Inc
Probability and Statistics for Engineering and th…
Statistics
ISBN:
9781305251809
Author:
Jay L. Devore
Publisher:
Cengage Learning
Statistics for The Behavioral Sciences (MindTap C…
Statistics
ISBN:
9781305504912
Author:
Frederick J Gravetter, Larry B. Wallnau
Publisher:
Cengage Learning

Elementary Statistics: Picturing the World (7th E…
Statistics
ISBN:
9780134683416
Author:
Ron Larson, Betsy Farber
Publisher:
PEARSON

The Basic Practice of Statistics
Statistics
ISBN:
9781319042578
Author:
David S. Moore, William I. Notz, Michael A. Fligner
Publisher:
W. H. Freeman

Introduction to the Practice of Statistics
Statistics
ISBN:
9781319013387
Author:
David S. Moore, George P. McCabe, Bruce A. Craig
Publisher:
W. H. Freeman