A plant resistant for a certain disease was crossed with another type of plant partially susceptible to the disease. A plant geneticist claimed that 75% of the offsprings re- sulting from the cross will be resistant to the disease. To test this claim, 150 seeds from this cross were collected and germinated. Of these plants, 110 plants were found resistant to the disease. (i) Write the hypotheses. (ii) conditions that are required. Write the test statistic. State the assumptions being made and test the ii) Write the distribution of the test statistic under the null hypothesis. Find the p-value in this context and interpret it. Drawing a picture may (iv) be helpful.
A plant resistant for a certain disease was crossed with another type of plant partially susceptible to the disease. A plant geneticist claimed that 75% of the offsprings re- sulting from the cross will be resistant to the disease. To test this claim, 150 seeds from this cross were collected and germinated. Of these plants, 110 plants were found resistant to the disease. (i) Write the hypotheses. (ii) conditions that are required. Write the test statistic. State the assumptions being made and test the ii) Write the distribution of the test statistic under the null hypothesis. Find the p-value in this context and interpret it. Drawing a picture may (iv) be helpful.

MATLAB: An Introduction with Applications
6th Edition
ISBN:9781119256830
Author:Amos Gilat
Publisher:Amos Gilat
Chapter1: Starting With Matlab
Section: Chapter Questions
Problem 1P

Related questions
Question
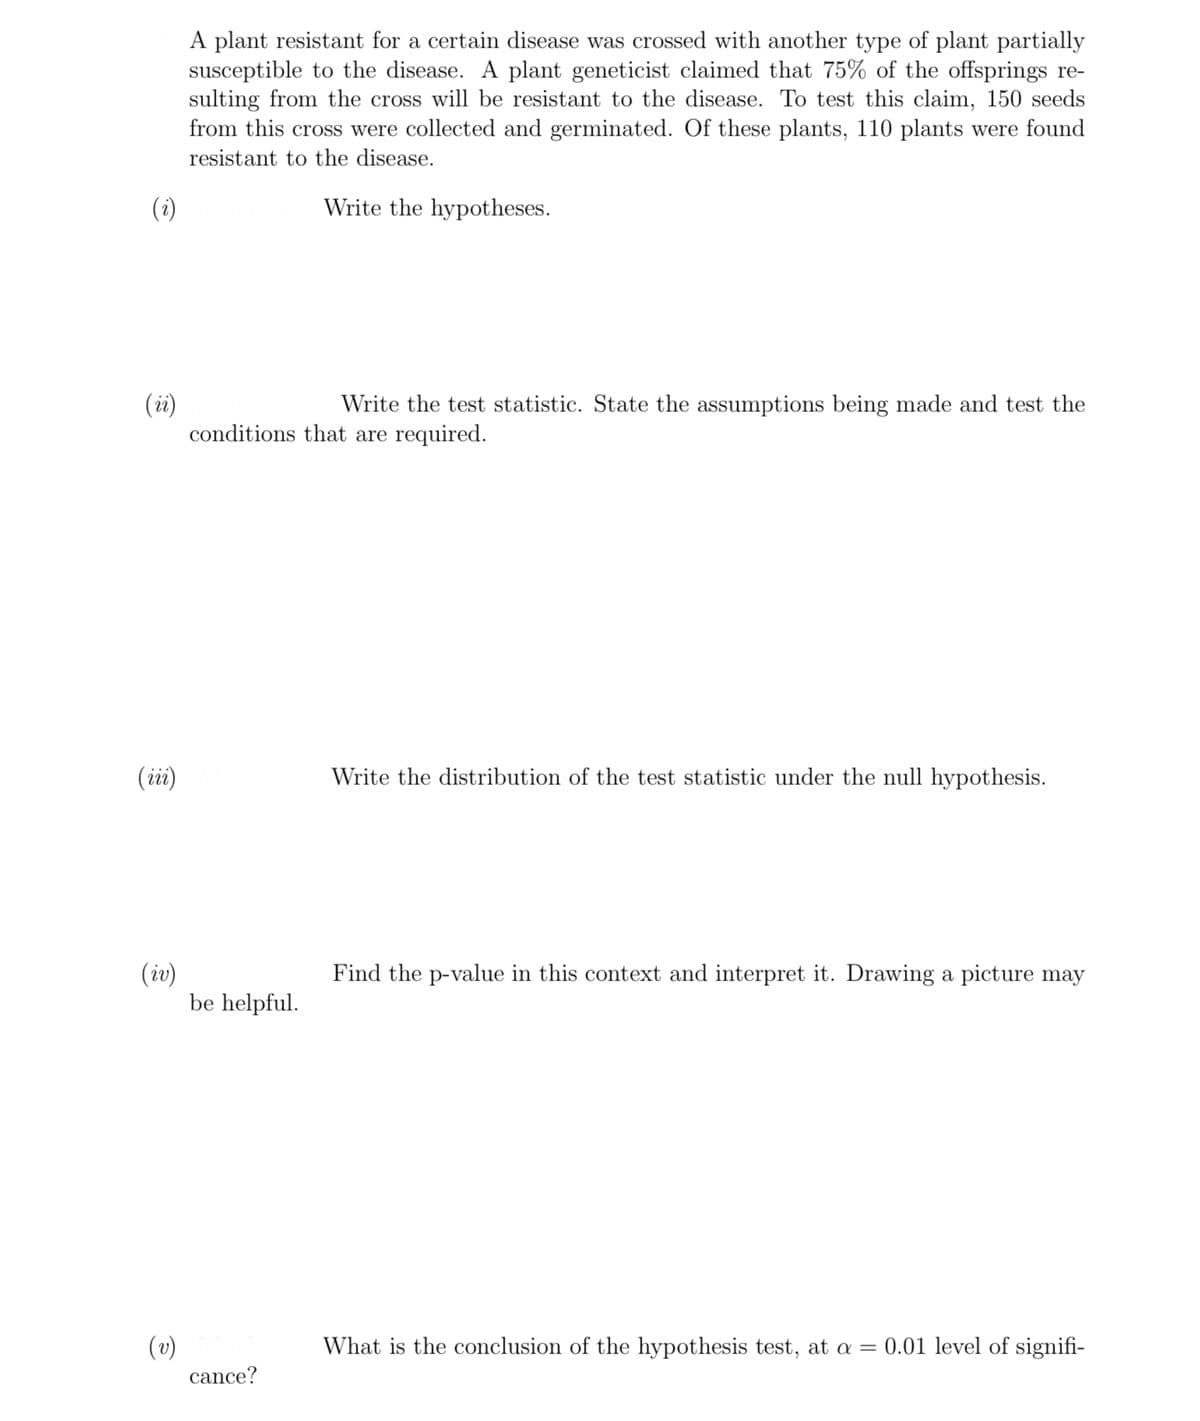
Transcribed Image Text:A plant resistant for a certain disease was crossed with another type of plant partially
susceptible to the disease. A plant geneticist claimed that 75% of the offsprings re-
sulting from the cross will be resistant to the disease. To test this claim, 150 seeds
from this cross were collected and germinated. Of these plants, 110 plants were found
resistant to the disease.
(i)
Write the hypotheses.
(ii)
conditions that are required.
Write the test statistic. State the assumptions being made and test the
(ii)
Write the distribution of the test statistic under the null hypothesis.
Find the p-value in this context and interpret it. Drawing a picture may
(iv)
be helpful.
What is the conclusion of the hypothesis test, at a =
0.01 level of signifi-
(v)
cance?
Expert Solution
This question has been solved!
Explore an expertly crafted, step-by-step solution for a thorough understanding of key concepts.

Step by step
Solved in 2 steps with 2 images

Recommended textbooks for you
MATLAB: An Introduction with Applications
Statistics
ISBN:
9781119256830
Author:
Amos Gilat
Publisher:
John Wiley & Sons Inc

Probability and Statistics for Engineering and th…
Statistics
ISBN:
9781305251809
Author:
Jay L. Devore
Publisher:
Cengage Learning

Statistics for The Behavioral Sciences (MindTap C…
Statistics
ISBN:
9781305504912
Author:
Frederick J Gravetter, Larry B. Wallnau
Publisher:
Cengage Learning
MATLAB: An Introduction with Applications
Statistics
ISBN:
9781119256830
Author:
Amos Gilat
Publisher:
John Wiley & Sons Inc
Probability and Statistics for Engineering and th…
Statistics
ISBN:
9781305251809
Author:
Jay L. Devore
Publisher:
Cengage Learning
Statistics for The Behavioral Sciences (MindTap C…
Statistics
ISBN:
9781305504912
Author:
Frederick J Gravetter, Larry B. Wallnau
Publisher:
Cengage Learning

Elementary Statistics: Picturing the World (7th E…
Statistics
ISBN:
9780134683416
Author:
Ron Larson, Betsy Farber
Publisher:
PEARSON

The Basic Practice of Statistics
Statistics
ISBN:
9781319042578
Author:
David S. Moore, William I. Notz, Michael A. Fligner
Publisher:
W. H. Freeman

Introduction to the Practice of Statistics
Statistics
ISBN:
9781319013387
Author:
David S. Moore, George P. McCabe, Bruce A. Craig
Publisher:
W. H. Freeman