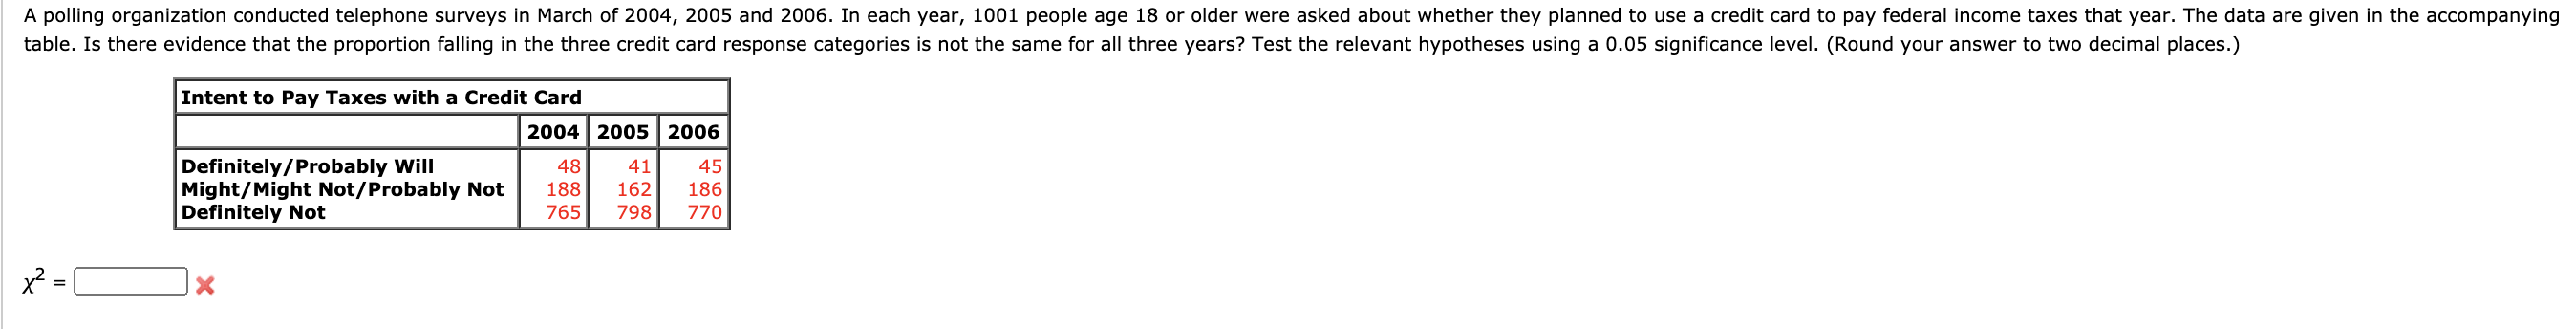
A polling organization conducted telephone surveys in March of 2004, 2005 and 2006. In each year, 1001 people age 18 or older were asked about whether they planned to use a credit card to pay federal income taxes that year. The data are given in the accompanying table. Is there evidence that the proportion falling in the three credit card response categories is not the same for all three years? Test the relevant hypotheses using a 0.05 significance level. (Round your answer to two decimal places.) Intent to Pay Taxes with a Credit Card 2004 2005 2006 Definitely/Probably Will Might/Might Not/Probably Not Definitely Not 48 41 45 188 162 186 765 798 770 x² =
A polling organization conducted telephone surveys in March of 2004, 2005 and 2006. In each year, 1001 people age 18 or older were asked about whether they planned to use a credit card to pay federal income taxes that year. The data are given in the accompanying table. Is there evidence that the proportion falling in the three credit card response categories is not the same for all three years? Test the relevant hypotheses using a 0.05 significance level. (Round your answer to two decimal places.) Intent to Pay Taxes with a Credit Card 2004 2005 2006 Definitely/Probably Will Might/Might Not/Probably Not Definitely Not 48 41 45 188 162 186 765 798 770 x² =

Glencoe Algebra 1, Student Edition, 9780079039897, 0079039898, 2018
18th Edition
ISBN:9780079039897
Author:Carter
Publisher:Carter
Chapter10: Statistics
Section10.6: Summarizing Categorical Data
Problem 30PPS

Related questions

Question
100%
Thanks in advance!
Transcribed Image Text:A polling organization conducted telephone surveys in March of 2004, 2005 and 2006. In each year, 1001 people age 18 or older were asked about whether they planned to use a credit card to pay federal income taxes that year. The data are given in the accompanying
table. Is there evidence that the proportion falling in the three credit card response categories is not the same for all three years? Test the relevant hypotheses using a 0.05 significance level. (Round your answer to two decimal places.)
Intent to Pay Taxes with a Credit Card
2004 2005 2006
Definitely/Probably Will
Might/Might Not/Probably Not
Definitely Not
48
41
45
188
162
186
765
798
770
x² =
Expert Solution
This question has been solved!
Explore an expertly crafted, step-by-step solution for a thorough understanding of key concepts.

This is a popular solution!

Trending now
This is a popular solution!

Step by step
Solved in 3 steps with 4 images

Knowledge Booster


Learn more about
Need a deep-dive on the concept behind this application? Look no further. Learn more about this topic, statistics and related others by exploring similar questions and additional content below.Recommended textbooks for you
Glencoe Algebra 1, Student Edition, 9780079039897…
Algebra
ISBN:
9780079039897
Author:
Carter
Publisher:
McGraw Hill

College Algebra (MindTap Course List)
Algebra
ISBN:
9781305652231
Author:
R. David Gustafson, Jeff Hughes
Publisher:
Cengage Learning
Glencoe Algebra 1, Student Edition, 9780079039897…
Algebra
ISBN:
9780079039897
Author:
Carter
Publisher:
McGraw Hill
College Algebra (MindTap Course List)
Algebra
ISBN:
9781305652231
Author:
R. David Gustafson, Jeff Hughes
Publisher:
Cengage Learning