A publisher faces the following demand schedule for the next novel from one of its popular authors: Price Quantity Demanded (Dollars) (Copies) 100 0 90 100,000 80 200,000 70 300,000 60 400,000 50 500,000 40 600,000 30 700,000 20 800,000 10 900,000 0 1,000,000 The author is paid $2 million to write the novel, and the marginal cost of publishing the novel is a constant $10 per copy. Complete the second, fourth, and fifth columns of the following table by computing total revenue, total cost, and profit at each quantity. Quantity Total Revenue Marginal Revenue Total Cost Profit (Copies) (Dollars) (Dollars) (Dollars) (Dollars) 0 100,000 200,000 300,000 400,000 500,000 600,000 700,000 800,000 900,000 1,000,000 Which of the following quantity–price combinations would a profit-maximizing publisher choose? (Note: If the publisher is indifferent between more than one choice, select all of the indifferent combinations.) Check all that apply. 300,000 copies at a price of $70 400,000 copies at a price of $60 500,000 copies at a price of $50 600,000 copies at a price of $40 Complete the third column of the previous table by computing marginal revenue. (Hint: Recall that MR=ΔTRΔQMR=ΔTRΔQ.) True or False: At each quantity, marginal revenue is less than the price. True or False
A publisher faces the following demand schedule for the next novel from one of its popular authors: Price Quantity Demanded (Dollars) (Copies) 100 0 90 100,000 80 200,000 70 300,000 60 400,000 50 500,000 40 600,000 30 700,000 20 800,000 10 900,000 0 1,000,000 The author is paid $2 million to write the novel, and the marginal cost of publishing the novel is a constant $10 per copy. Complete the second, fourth, and fifth columns of the following table by computing total revenue, total cost, and profit at each quantity. Quantity Total Revenue Marginal Revenue Total Cost Profit (Copies) (Dollars) (Dollars) (Dollars) (Dollars) 0 100,000 200,000 300,000 400,000 500,000 600,000 700,000 800,000 900,000 1,000,000 Which of the following quantity–price combinations would a profit-maximizing publisher choose? (Note: If the publisher is indifferent between more than one choice, select all of the indifferent combinations.) Check all that apply. 300,000 copies at a price of $70 400,000 copies at a price of $60 500,000 copies at a price of $50 600,000 copies at a price of $40 Complete the third column of the previous table by computing marginal revenue. (Hint: Recall that MR=ΔTRΔQMR=ΔTRΔQ.) True or False: At each quantity, marginal revenue is less than the price. True or False

Principles of Economics, 7th Edition (MindTap Course List)
7th Edition
ISBN:9781285165875
Author:N. Gregory Mankiw
Publisher:N. Gregory Mankiw
Chapter13: The Cost Of Production
Section: Chapter Questions
Problem 9PA

Related questions
Question
A publisher faces the following demand schedule for the next novel from one of its popular authors:
|
|
Quantity Demanded
|
|---|---|
|
(Dollars)
|
(Copies)
|
| 100 | 0 |
| 90 | 100,000 |
| 80 | 200,000 |
| 70 | 300,000 |
| 60 | 400,000 |
| 50 | 500,000 |
| 40 | 600,000 |
| 30 | 700,000 |
| 20 | 800,000 |
| 10 | 900,000 |
| 0 | 1,000,000 |
The author is paid $2 million to write the novel, and the marginal cost of publishing the novel is a constant $10 per copy.
Complete the second, fourth, and fifth columns of the following table by computing total revenue, total cost, and profit at each quantity.
|
Quantity
|
Total Revenue
|
Marginal Revenue
|
Total Cost
|
Profit
|
|---|---|---|---|---|
|
(Copies)
|
(Dollars)
|
(Dollars)
|
(Dollars)
|
(Dollars)
|
| 0 |
|
|
|
|
|
|
||||
| 100,000 |
|
|
|
|
|
|
||||
| 200,000 |
|
|
|
|
|
|
||||
| 300,000 |
|
|
|
|
|
|
||||
| 400,000 |
|
|
|
|
|
|
||||
| 500,000 |
|
|
|
|
|
|
||||
| 600,000 |
|
|
|
|
|
|
||||
| 700,000 |
|
|
|
|
|
|
||||
| 800,000 |
|
|
|
|
|
|
||||
| 900,000 |
|
|
|
|
|
|
||||
| 1,000,000 |
|
|
|
Which of the following quantity–price combinations would a profit-maximizing publisher choose?
(Note: If the publisher is indifferent between more than one choice, select all of the indifferent combinations.)
Check all that apply.
300,000 copies at a price of $70
400,000 copies at a price of $60
500,000 copies at a price of $50
600,000 copies at a price of $40
Complete the third column of the previous table by computing marginal revenue. (Hint: Recall that MR=ΔTRΔQMR=ΔTRΔQ.)
True or False: At each quantity, marginal revenue is less than the price.
True
or
False
pic 2 :
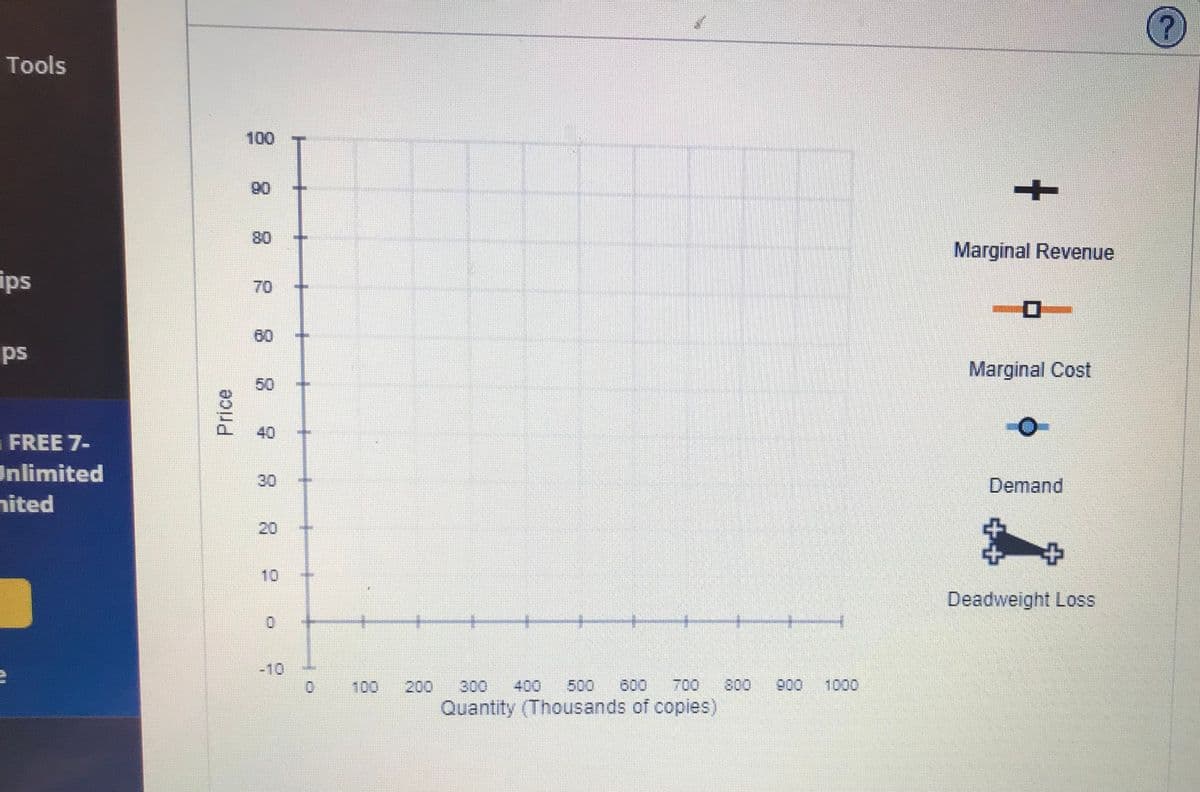
Use the black points (plus symbol) to graph the marginal revenue from the 100,000th, 200,000th, 300,000th, 400,000th, 500,000th, and 600,000th copy of the novel. Remember to plot from left to right and to plot between integers. For example, if the marginal revenue of increasing production from 100,000 copies to 200,000 copies were 10, then you would plot a point at (150, 10). Next use the orange line (square symbol) to graph the marginal-cost curve faced by the publisher. Finally, use the blue points (circle symbol) to graph demand at the following quantities (in thousands): 0, 100, 200, 300, 400, 500, 600, 700, 800, 900, and 1,000.
The marginal-revenue and marginal-cost curves intersect at a quantity of (?) copies.
On the previous graph, use the black triangle (plus symbols) to shade the area representing deadweight loss .
If the author were paid $3 million instead of $2 million to write the book, the publisher would (?) the price it charges for a copy of the novel.
Suppose the publisher was not profit-maximizing but was concerned with maximizing economic efficiency, and the author of a novel was paid $2 million to write the book.
In this case, the publisher would charge ($) ?
for a copy of the novel and earn a profit of ( $) ?
(Note: If the publisher experiences a loss, be sure to enter a negative number for profit.)
Transcribed Image Text:Tools
100
06
80
Marginal Revenue
ips
70
60
ps
Marginal Cost
50
40
FREE 7-
Inlimited
30
Demand
nited
10
Deadweight Loss
-10
100
200
300
400
500
600
700
800
900
1000
Quantity (Thousands of copies)
Price
20
Transcribed Image Text:Q Searc
Problems & Applications(Ch 13)
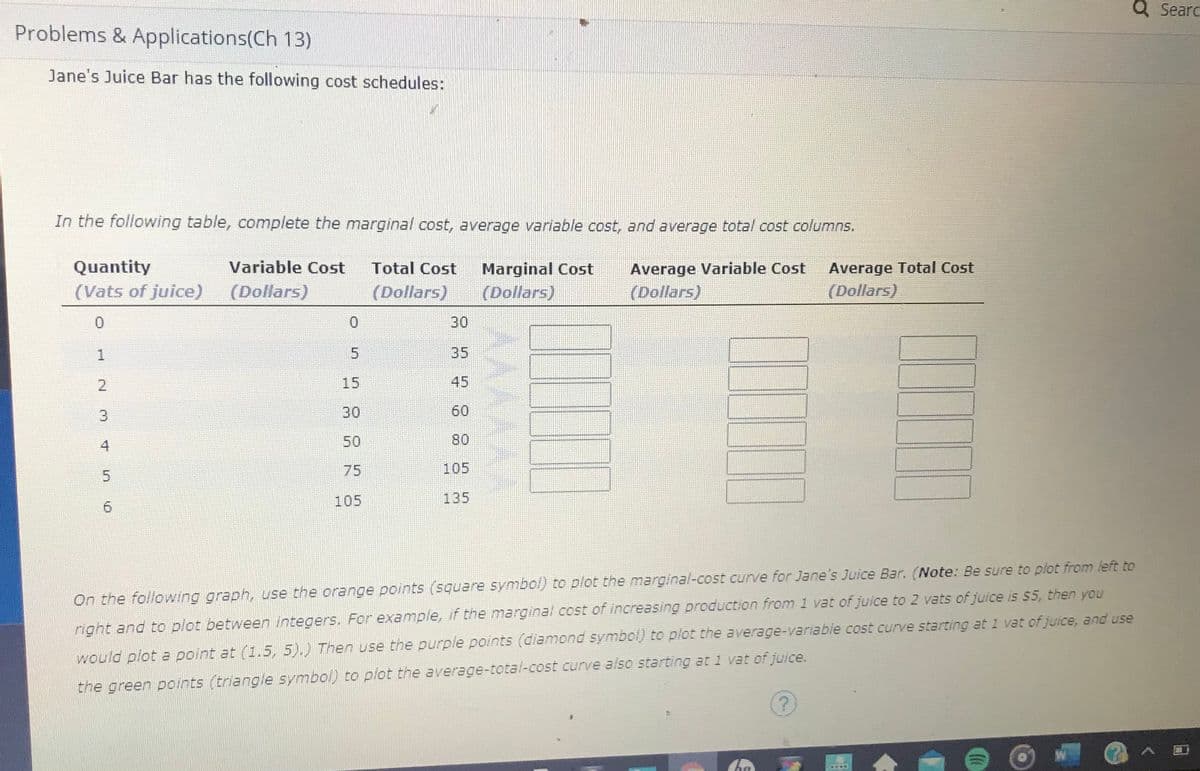
Jane's Juice Bar has the following cost schedules:
In the following table, complete the marginal cost, average variable cost, and average total cost columns.
Quantity
Variable Cost
Total Cost
Marginal Cost
Average Variable Cost
Average Total Cost
(Vats of juice)
(Dollars)
(Dollars)
(Dollars)
(Dollars)
(Dollars)
0.
30
1
35
2
15
45
30
60
4
50
80
75
105
5.
105
135
On the following graph, use the orange points (square symbol) to plot the marginal-cost curve for Jane's Juice Bar. (Note: Be sure to plot from left to
right and to plot between integers. For example, if the marginal cost of increasing production from 1 vat of juice to 2 vats of juice is $5, then you
would plot e point at (1.5, 5).) Then use the purple points (diamond symbol) to plot the average-variable cost curve starting at 1 vat of juice, and use
the green points (triangle symbol) to plot the average-total-cost curve also starting at 1 vat of juice.
3.
Expert Solution
This question has been solved!
Explore an expertly crafted, step-by-step solution for a thorough understanding of key concepts.

This is a popular solution!

Trending now
This is a popular solution!

Step by step
Solved in 5 steps with 4 images

Knowledge Booster


Learn more about
Need a deep-dive on the concept behind this application? Look no further. Learn more about this topic, economics and related others by exploring similar questions and additional content below.Recommended textbooks for you
Principles of Economics, 7th Edition (MindTap Cou…
Economics
ISBN:
9781285165875
Author:
N. Gregory Mankiw
Publisher:
Cengage Learning

Essentials of Economics (MindTap Course List)
Economics
ISBN:
9781337091992
Author:
N. Gregory Mankiw
Publisher:
Cengage Learning

Principles of Economics (MindTap Course List)
Economics
ISBN:
9781305585126
Author:
N. Gregory Mankiw
Publisher:
Cengage Learning
Principles of Economics, 7th Edition (MindTap Cou…
Economics
ISBN:
9781285165875
Author:
N. Gregory Mankiw
Publisher:
Cengage Learning
Essentials of Economics (MindTap Course List)
Economics
ISBN:
9781337091992
Author:
N. Gregory Mankiw
Publisher:
Cengage Learning
Principles of Economics (MindTap Course List)
Economics
ISBN:
9781305585126
Author:
N. Gregory Mankiw
Publisher:
Cengage Learning

Principles of Economics 2e
Economics
ISBN:
9781947172364
Author:
Steven A. Greenlaw; David Shapiro
Publisher:
OpenStax

Managerial Economics: A Problem Solving Approach
Economics
ISBN:
9781337106665
Author:
Luke M. Froeb, Brian T. McCann, Michael R. Ward, Mike Shor
Publisher:
Cengage Learning
