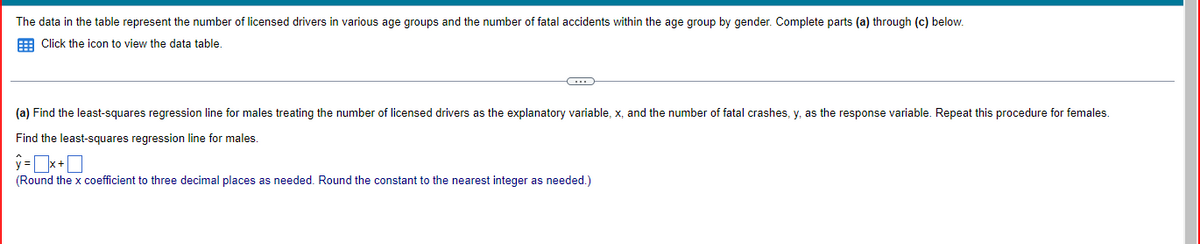
The data in the table represent the number of licensed drivers in various age groups and the number of fatal accidents within the age group by gender. Complete parts (a) through (c) below. Click the icon to view the data table. (a) Find the least-squares regression line for males treating the number of licensed drivers as the explanatory variable, x, and the number of fatal crashes, y, as the response variable. Repeat this procedure for females. Find the least-squares regression line for males. (Round the x coefficient to three decimal places as needed. Round the constant to the nearest integer as needed.)
The data in the table represent the number of licensed drivers in various age groups and the number of fatal accidents within the age group by gender. Complete parts (a) through (c) below. Click the icon to view the data table. (a) Find the least-squares regression line for males treating the number of licensed drivers as the explanatory variable, x, and the number of fatal crashes, y, as the response variable. Repeat this procedure for females. Find the least-squares regression line for males. (Round the x coefficient to three decimal places as needed. Round the constant to the nearest integer as needed.)

Chapter3: Polynomial Functions
Section: Chapter Questions
Problem 18T

Related questions
Question
Transcribed Image Text:The data in the table represent the number of licensed drivers in various age groups and the number of fatal accidents within the age group by gender. Complete parts (a) through (c) below.
Click the icon to view the data table.
C
(a) Find the least-squares regression line for males treating the number of licensed drivers as the explanatory variable, x, and the number of fatal crashes, y, as the response variable. Repeat this procedure for females.
Find the least-squares regression line for males.
ŷ=x+
(Round the x coefficient to three decimal places as needed. Round the constant to the nearest integer as needed.)
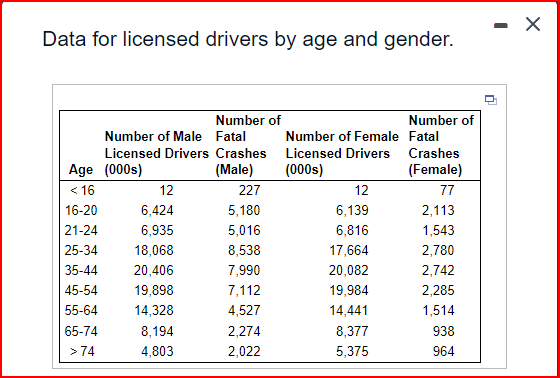
Transcribed Image Text:Data for licensed drivers by age and gender.
Number of
Number of
Fatal
Number of Male Fatal
Number of Female
Licensed Drivers
Licensed Drivers Crashes
Crashes
Age
(000s)
(Male)
(000s)
(Female)
< 16
12
12
77
16-20
6,424
6,139
2,113
21-24
6,935
6,816
1,543
25-34
18,068
17,664
2,780
35-44 20,406
20,082
2,742
45-54 19,898
19,984
2,285
55-64
14,328
14,441
1,514
65-74
8,194
8,377
938
> 74
4,803
5,375
964
227
5,180
5,016
8,538
7,990
7,112
4,527
2,274
2,022
-
Expert Solution
This question has been solved!
Explore an expertly crafted, step-by-step solution for a thorough understanding of key concepts.

Step by step
Solved in 2 steps with 2 images

Recommended textbooks for you

Linear Algebra: A Modern Introduction
Algebra
ISBN:
9781285463247
Author:
David Poole
Publisher:
Cengage Learning

Elementary Linear Algebra (MindTap Course List)
Algebra
ISBN:
9781305658004
Author:
Ron Larson
Publisher:
Cengage Learning
Linear Algebra: A Modern Introduction
Algebra
ISBN:
9781285463247
Author:
David Poole
Publisher:
Cengage Learning
Elementary Linear Algebra (MindTap Course List)
Algebra
ISBN:
9781305658004
Author:
Ron Larson
Publisher:
Cengage Learning