A random variable X given in the probability distribution below is the number of persons entering the bank every hour during a span of one week which were recorded by the security guard. a) What is the expected number of persons entering the bank every hour during that week? b) Compute the variance and standard deviation by illustrating its calculation step by step. x 1 2 3 4 P(x) 0.10 0.20 0.45 0.25
A random variable X given in the probability distribution below is the number of persons entering the bank every hour during a span of one week which were recorded by the security guard. a) What is the expected number of persons entering the bank every hour during that week? b) Compute the variance and standard deviation by illustrating its calculation step by step. x 1 2 3 4 P(x) 0.10 0.20 0.45 0.25

MATLAB: An Introduction with Applications
6th Edition
ISBN:9781119256830
Author:Amos Gilat
Publisher:Amos Gilat
Chapter1: Starting With Matlab
Section: Chapter Questions
Problem 1P

Related questions
Question
Note: please follow the steps in the photo attached
![B. Variance and Standard Deviation of a Discrete Random Variable
The variance of a random variable is the expected value of the square of the difference between
the assumed value of random variable and the mean. It is denoted by ² or Var (X).
Var (X)=[(x-µ)² P(x)] or o² = (x-μ)² P(x)]
Where x = outcome, μ = population mean, P(x) =probability of the outcome
The standard deviation of a random variable denoted by o is the square root of the variance.
0 =
Σ[(x − µ)² P(x)]
Note: The larger the value of the variance or standard deviation, the farther are the values of X
from the mean. It means that the larger the value of the variance or standard deviation, the more
spread are the values X from the mean or expected value.
Example:
A researcher surveyed the households in a small town. The random variable X represents
the number of college graduates in the households. The probability distribution of X is shown
below. Determine the variance and standard deviation.
X
0
2
P(X=x)
0.25
0.50
0.25
Solution:
Step 1. Find the expected value.
Based from previous example, E(X) or μ =1.
Step 2. Subtract the expected value from each outcome. Square each difference.
Step 3. Multiply each squared difference by the corresponding probability.
Step 4. Sum up all the figures obtained in step 3.
X
P(x)
x P(x)
x-μ
(x-μ)² P(x)
(x-μ)²
1
0
0.25
0
0-1 -1
1(0.25) = 0.25
1
0.50
0.50
1-1=0
0
0(0.50)=0
2
0.25
0.50
2-1=1
1
1(0.25) = 0.25
[x P(x)] = 1.00
0² =
[(x-μ)² P(x)] = 0.50
Variance, o² = 0.50
(You just need to take the square root of the value of variance to compute the standard deviation)
Standard Deviation, o = √0.50 ≈ 0.71
Based from the standard deviation it is evident that the variance or standard de
shows a low measure of spread which is associated with the random variable X
corresponding probabilities. In other words, the possible values x and their corres
probabilities are close to each other.
Take note that it is easier to interpret the value of standard deviation because it uses
same unit of measure of the random variable X.](/v2/_next/image?url=https%3A%2F%2Fcontent.bartleby.com%2Fqna-images%2Fquestion%2F217971ec-eb4d-4d86-9586-aa9c02b9bf29%2Fa10cf6ae-e716-4609-a0a4-9c2acbd78cbc%2Fotgsy6l_processed.jpeg&w=3840&q=75)
Transcribed Image Text:B. Variance and Standard Deviation of a Discrete Random Variable
The variance of a random variable is the expected value of the square of the difference between
the assumed value of random variable and the mean. It is denoted by ² or Var (X).
Var (X)=[(x-µ)² P(x)] or o² = (x-μ)² P(x)]
Where x = outcome, μ = population mean, P(x) =probability of the outcome
The standard deviation of a random variable denoted by o is the square root of the variance.
0 =
Σ[(x − µ)² P(x)]
Note: The larger the value of the variance or standard deviation, the farther are the values of X
from the mean. It means that the larger the value of the variance or standard deviation, the more
spread are the values X from the mean or expected value.
Example:
A researcher surveyed the households in a small town. The random variable X represents
the number of college graduates in the households. The probability distribution of X is shown
below. Determine the variance and standard deviation.
X
0
2
P(X=x)
0.25
0.50
0.25
Solution:
Step 1. Find the expected value.
Based from previous example, E(X) or μ =1.
Step 2. Subtract the expected value from each outcome. Square each difference.
Step 3. Multiply each squared difference by the corresponding probability.
Step 4. Sum up all the figures obtained in step 3.
X
P(x)
x P(x)
x-μ
(x-μ)² P(x)
(x-μ)²
1
0
0.25
0
0-1 -1
1(0.25) = 0.25
1
0.50
0.50
1-1=0
0
0(0.50)=0
2
0.25
0.50
2-1=1
1
1(0.25) = 0.25
[x P(x)] = 1.00
0² =
[(x-μ)² P(x)] = 0.50
Variance, o² = 0.50
(You just need to take the square root of the value of variance to compute the standard deviation)
Standard Deviation, o = √0.50 ≈ 0.71
Based from the standard deviation it is evident that the variance or standard de
shows a low measure of spread which is associated with the random variable X
corresponding probabilities. In other words, the possible values x and their corres
probabilities are close to each other.
Take note that it is easier to interpret the value of standard deviation because it uses
same unit of measure of the random variable X.
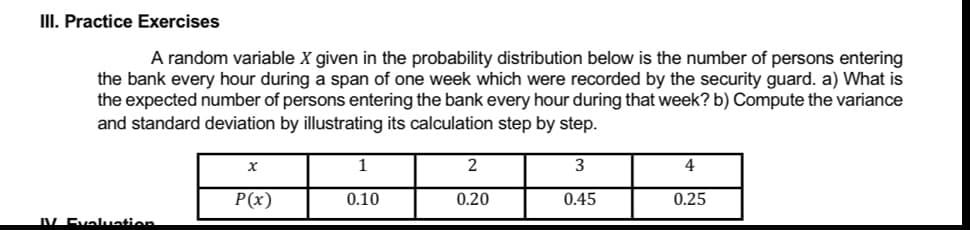
Transcribed Image Text:III. Practice Exercises
A random variable X given in the probability distribution below is the number of persons entering
the bank every hour during a span of one week which were recorded by the security guard. a) What is
the expected number of persons entering the bank every hour during that week? b) Compute the variance
and standard deviation by illustrating its calculation step by step.
1
x
2
3
4
P(x)
0.10
0.20
0.45
0.25
IV Evaluation
Expert Solution
This question has been solved!
Explore an expertly crafted, step-by-step solution for a thorough understanding of key concepts.

Step by step
Solved in 3 steps with 2 images

Recommended textbooks for you
MATLAB: An Introduction with Applications
Statistics
ISBN:
9781119256830
Author:
Amos Gilat
Publisher:
John Wiley & Sons Inc

Probability and Statistics for Engineering and th…
Statistics
ISBN:
9781305251809
Author:
Jay L. Devore
Publisher:
Cengage Learning

Statistics for The Behavioral Sciences (MindTap C…
Statistics
ISBN:
9781305504912
Author:
Frederick J Gravetter, Larry B. Wallnau
Publisher:
Cengage Learning
MATLAB: An Introduction with Applications
Statistics
ISBN:
9781119256830
Author:
Amos Gilat
Publisher:
John Wiley & Sons Inc
Probability and Statistics for Engineering and th…
Statistics
ISBN:
9781305251809
Author:
Jay L. Devore
Publisher:
Cengage Learning
Statistics for The Behavioral Sciences (MindTap C…
Statistics
ISBN:
9781305504912
Author:
Frederick J Gravetter, Larry B. Wallnau
Publisher:
Cengage Learning

Elementary Statistics: Picturing the World (7th E…
Statistics
ISBN:
9780134683416
Author:
Ron Larson, Betsy Farber
Publisher:
PEARSON

The Basic Practice of Statistics
Statistics
ISBN:
9781319042578
Author:
David S. Moore, William I. Notz, Michael A. Fligner
Publisher:
W. H. Freeman

Introduction to the Practice of Statistics
Statistics
ISBN:
9781319013387
Author:
David S. Moore, George P. McCabe, Bruce A. Craig
Publisher:
W. H. Freeman