The density of people per square kilometer for African countries is in table #2.2.11 ('Density of people,' 2013). Create a frequency distribution and a relative frequency distribution using 7 classes. a) Since data were collected for variable(s), the correct graph to make is a . b) Using the formula class width = (maxX - minX)/(number of classes) and rounding up to the next whole number, the class width is Complete the frequency/relative frequency table using 7 classes. Round relative frequencies to 3 decimal places.
The density of people per square kilometer for African countries is in table #2.2.11 ('Density of people,' 2013). Create a frequency distribution and a relative frequency distribution using 7 classes. a) Since data were collected for variable(s), the correct graph to make is a . b) Using the formula class width = (maxX - minX)/(number of classes) and rounding up to the next whole number, the class width is Complete the frequency/relative frequency table using 7 classes. Round relative frequencies to 3 decimal places.

Glencoe Algebra 1, Student Edition, 9780079039897, 0079039898, 2018
18th Edition
ISBN:9780079039897
Author:Carter
Publisher:Carter
Chapter10: Statistics
Section10.4: Distributions Of Data
Problem 19PFA

Related questions
Question
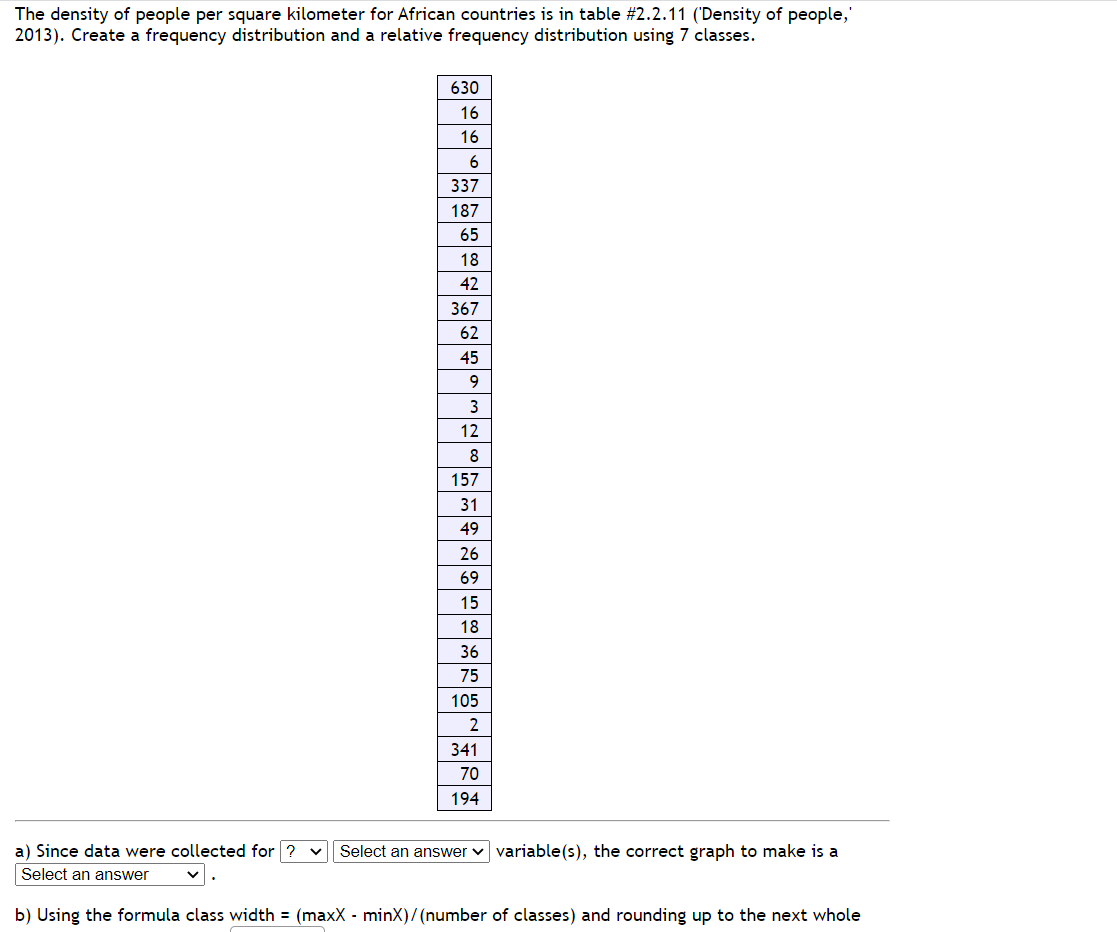
The density of people per square kilometer for African countries is in table #2.2.11 ('Density of people,' 2013). Create a frequency distribution and a relative frequency distribution using 7 classes.
a) Since data were collected for variable(s), the correct graph to make is a .
b) Using the formula class width = (maxX - minX)/(number of classes) and rounding up to the next whole number, the class width is
Complete the frequency/relative frequency table using 7 classes.
Round relative frequencies to 3 decimal places.
Transcribed Image Text:The density of people per square kilometer for African countries is in table # 2.2.11 ('Density of people,'
2013). Create a frequency distribution and a relative frequency distribution using 7 classes.
a) Since data were collected for ?
an answer
630
16
16
6
337
187
65
18
TEM
42
367
62
45
9
3
12
8
157
31
49
26
69
15
18
36
Nw.
75
105
2
341
70
194
Select an answer variable(s), the correct graph to make is a
b) Using the formula class width= (maxX - minX)/(number of classes) and rounding up to the next whole
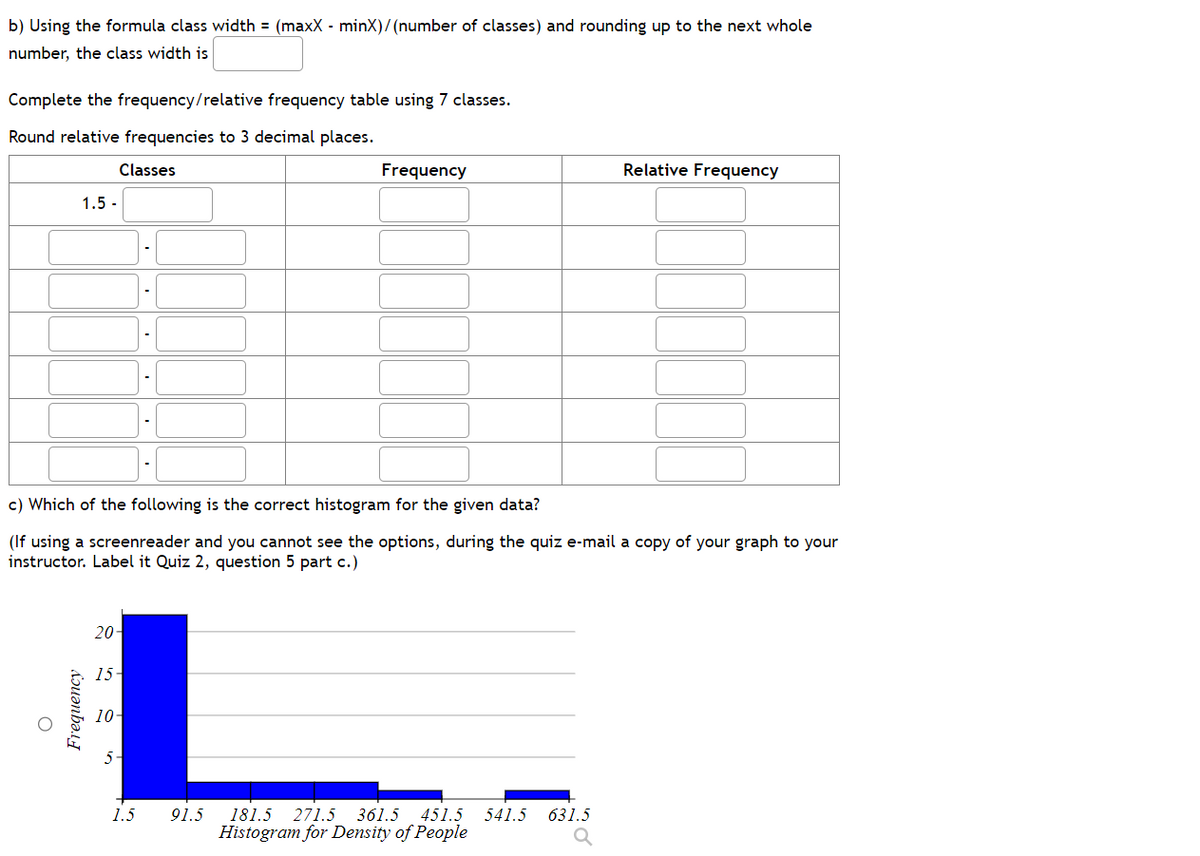
Transcribed Image Text:b) Using the formula class width = (maxX - minX)/(number of classes) and rounding up to the next whole
number, the class width is
Complete the frequency/relative frequency table using 7 classes.
Round relative frequencies to 3 decimal places.
Classes
1.5-
Frequency
O
20-
c) Which of the following is the correct histogram for the given data?
(If using a screenreader and you cannot see the options, during the quiz e-mail a copy of your graph to your
instructor. Label it Quiz 2, question 5 part c.)
15-
1.1
10-
1.5
Frequency
91.5
Relative Frequency
181.5 271.5 361.5 451.5 541.5 631.5
Histogram for Density of People
Expert Solution
This question has been solved!
Explore an expertly crafted, step-by-step solution for a thorough understanding of key concepts.

This is a popular solution!

Trending now
This is a popular solution!

Step by step
Solved in 5 steps with 2 images

Recommended textbooks for you
Glencoe Algebra 1, Student Edition, 9780079039897…
Algebra
ISBN:
9780079039897
Author:
Carter
Publisher:
McGraw Hill
Glencoe Algebra 1, Student Edition, 9780079039897…
Algebra
ISBN:
9780079039897
Author:
Carter
Publisher:
McGraw Hill