A recent national report states the marital status distribution of the male population age 18 or older is as follows: Never Married (31.7%), Married (54.7%), Widowed (2.8%), Divorced (10.8 % ) . The table below shows the results of a random sample of 1888 adult men from California. Test the claim that the distribution from California is as expected at the a = 0.10 significance level. a. Complete the table by filling in the expected frequencies. Round to the nearest whole number: Frequencies of Marital Status Outcome Frequency Expected Frequency Never Married 624 Married 1015 Widowed 36 Divorced 213 b. What is the correct statistical test to use? Goodness-of-Fit c. What are the null and alternative hypotheses? Ho: The distribution of marital status in California is not the same as it is nationally. Marital status and residency are dependent. The distribution of marital status in California is the same as it is nationally. Marital status and residency are independent. H₁: Marital status and residency are dependent. Marital status and residency are independent. The distribution of marital status in California is the same as it is nationally. The distribution of marital status in California is not the same as it is nationally. (Please show your answer to three decimal places.) (Please show your answer to four decimal places.) 1000 d. The degrees of freedom = e. The test-statistic for this data = f. The p-value for this sample=
A recent national report states the marital status distribution of the male population age 18 or older is as follows: Never Married (31.7%), Married (54.7%), Widowed (2.8%), Divorced (10.8 % ) . The table below shows the results of a random sample of 1888 adult men from California. Test the claim that the distribution from California is as expected at the a = 0.10 significance level. a. Complete the table by filling in the expected frequencies. Round to the nearest whole number: Frequencies of Marital Status Outcome Frequency Expected Frequency Never Married 624 Married 1015 Widowed 36 Divorced 213 b. What is the correct statistical test to use? Goodness-of-Fit c. What are the null and alternative hypotheses? Ho: The distribution of marital status in California is not the same as it is nationally. Marital status and residency are dependent. The distribution of marital status in California is the same as it is nationally. Marital status and residency are independent. H₁: Marital status and residency are dependent. Marital status and residency are independent. The distribution of marital status in California is the same as it is nationally. The distribution of marital status in California is not the same as it is nationally. (Please show your answer to three decimal places.) (Please show your answer to four decimal places.) 1000 d. The degrees of freedom = e. The test-statistic for this data = f. The p-value for this sample=

Glencoe Algebra 1, Student Edition, 9780079039897, 0079039898, 2018
18th Edition
ISBN:9780079039897
Author:Carter
Publisher:Carter
Chapter10: Statistics
Section10.4: Distributions Of Data
Problem 19PFA

Related questions
Question
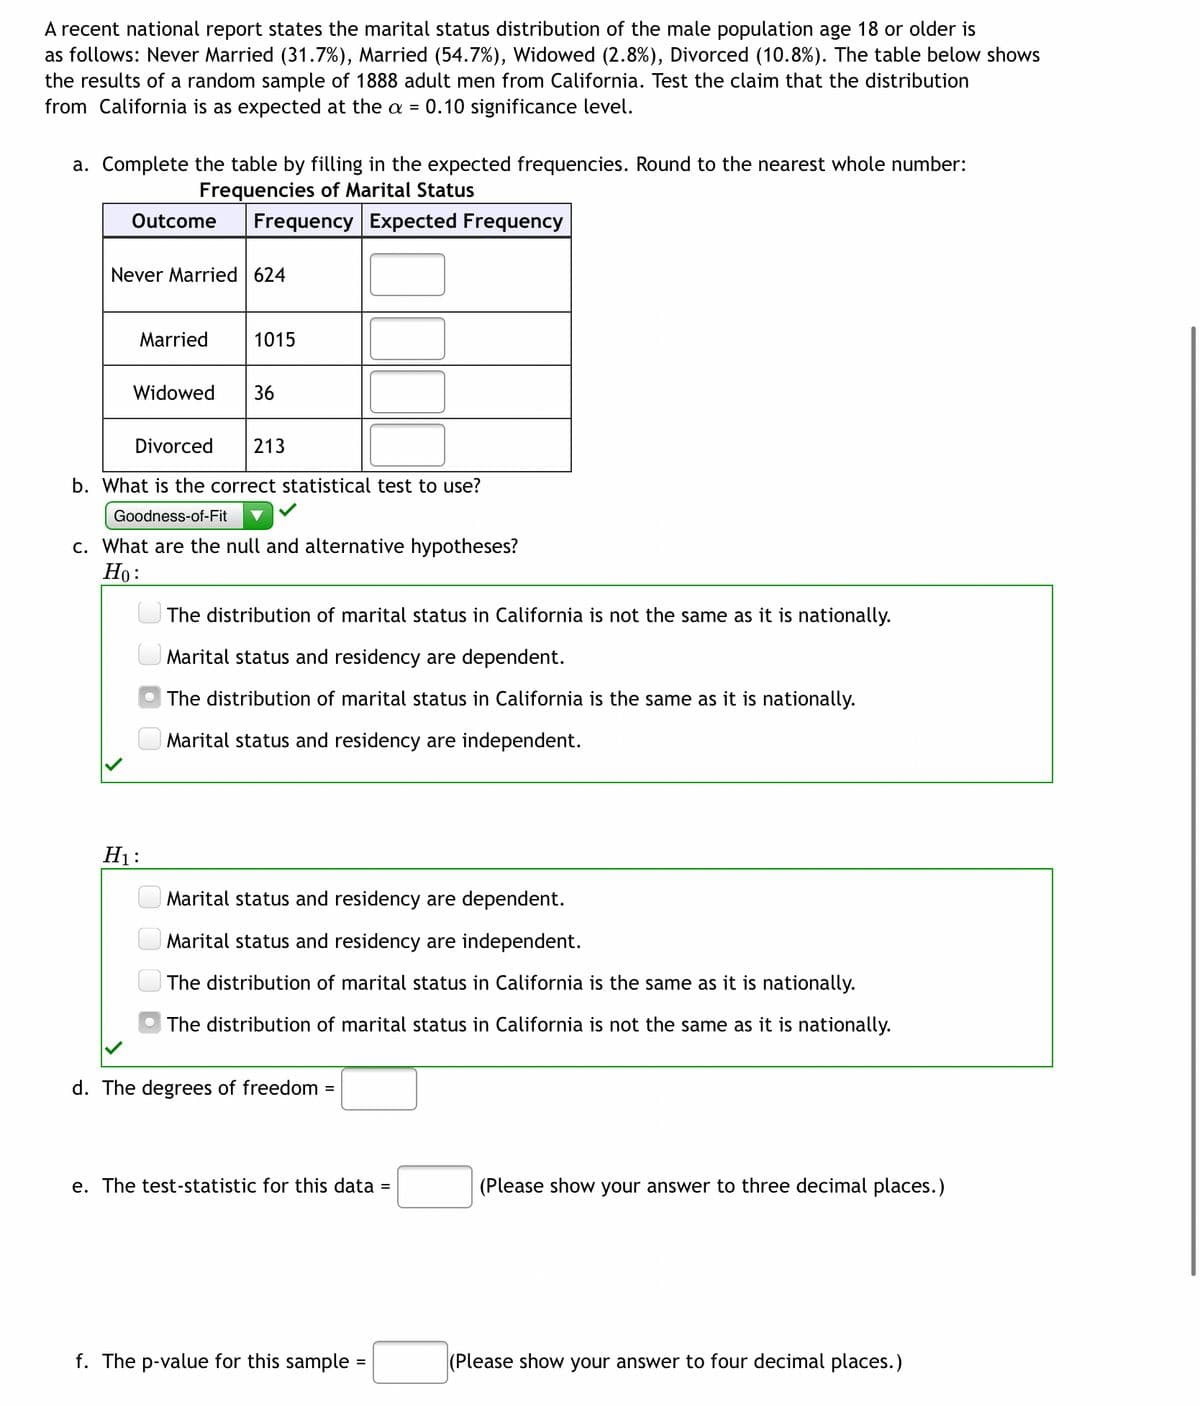
Transcribed Image Text:A recent national report states the marital status distribution of the male population age 18 or older is
as follows: Never Married (31.7%), Married (54.7%), Widowed (2.8%), Divorced (10.8%). The table below shows
the results of a random sample of 1888 adult men from California. Test the claim that the distribution
from California is as expected at the a 0.10 significance level.
=
a. Complete the table by filling in the expected frequencies. Round to the nearest whole number:
Frequencies of Marital Status
Outcome Frequency Expected Frequency
Never Married 624
Married
1015
Widowed 36
Divorced 213
b. What is the correct statistical test to use?
Goodness-of-Fit
c. What are the null and alternative hypotheses?
Ho:
The distribution of marital status in California is not the same as it is nationally.
Marital status and residency are dependent.
The distribution of marital status in California is the same as it is nationally.
Marital status and residency are independent.
H₁:
Marital status and residency are dependent.
Marital status and residency are independent.
The distribution of marital status in California is the same as it is nationally.
The distribution of marital status in California is not the same as it is nationally.
d. The degrees of freedom
=
e. The test-statistic for this data
=
(Please show your answer to three decimal places.)
f. The p-value for this sample=
(Please show your answer to four decimal places.)
56
Expert Solution
This question has been solved!
Explore an expertly crafted, step-by-step solution for a thorough understanding of key concepts.

This is a popular solution!

Trending now
This is a popular solution!

Step by step
Solved in 4 steps

Recommended textbooks for you
Glencoe Algebra 1, Student Edition, 9780079039897…
Algebra
ISBN:
9780079039897
Author:
Carter
Publisher:
McGraw Hill

College Algebra (MindTap Course List)
Algebra
ISBN:
9781305652231
Author:
R. David Gustafson, Jeff Hughes
Publisher:
Cengage Learning
Glencoe Algebra 1, Student Edition, 9780079039897…
Algebra
ISBN:
9780079039897
Author:
Carter
Publisher:
McGraw Hill
College Algebra (MindTap Course List)
Algebra
ISBN:
9781305652231
Author:
R. David Gustafson, Jeff Hughes
Publisher:
Cengage Learning