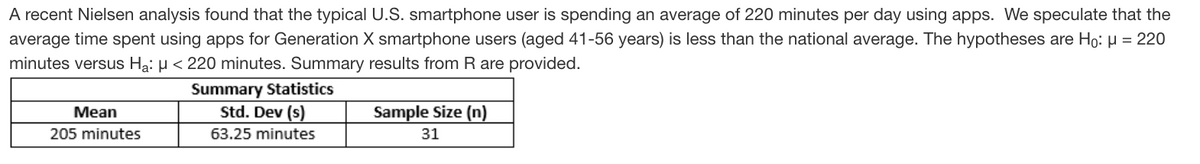
A recent Nielsen analysis found that the typical U.S. smartphone user is spending an average of 220 minutes per day using apps. We speculate that the average time spent using apps for Generation X smartphone users (aged 41-56 years) is less than the national average. The hypotheses are Ho: H = 220 minutes versus Ha: H< 220 minutes. Summary results from R are provided. Summary Statistics Std. Dev (s) Mean Sample Size (n) 205 minutes 63.25 minutes 31
A recent Nielsen analysis found that the typical U.S. smartphone user is spending an average of 220 minutes per day using apps. We speculate that the average time spent using apps for Generation X smartphone users (aged 41-56 years) is less than the national average. The hypotheses are Ho: H = 220 minutes versus Ha: H< 220 minutes. Summary results from R are provided. Summary Statistics Std. Dev (s) Mean Sample Size (n) 205 minutes 63.25 minutes 31

Linear Algebra: A Modern Introduction
4th Edition
ISBN:9781285463247
Author:David Poole
Publisher:David Poole
Chapter7: Distance And Approximation
Section7.3: Least Squares Approximation
Problem 31EQ

Related questions
Question
Transcribed Image Text:A recent Nielsen analysis found that the typical U.S. smartphone user is spending an average of 220 minutes per day using apps. We speculate that the
average time spent using apps for Generation X smartphone users (aged 41-56 years) is less than the national average. The hypotheses are Ho: H = 220
minutes versus Ha: µ < 220 minutes. Summary results from R are provided.
Summary Statistics
Std. Dev (s)
Mean
Sample Size (n)
205 minutes
63.25 minutes
31
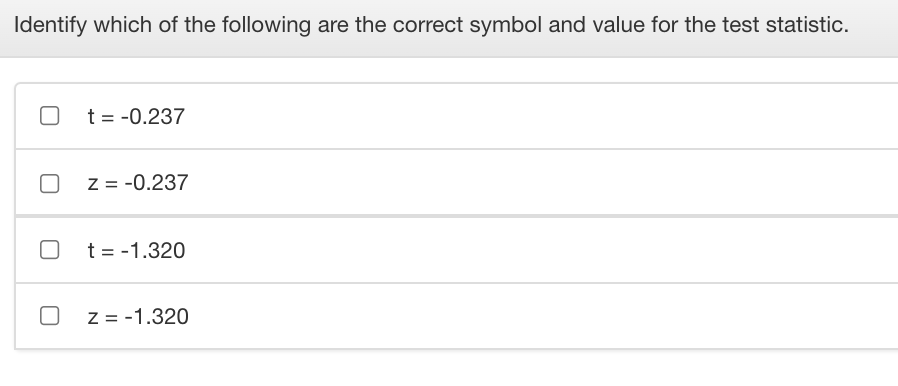
Transcribed Image Text:Identify which of the following are the correct symbol and value for the test statistic.
t = -0.237
Z = -0.237
t = -1.320
Z = -1.320
Expert Solution
This question has been solved!
Explore an expertly crafted, step-by-step solution for a thorough understanding of key concepts.

This is a popular solution!

Trending now
This is a popular solution!

Step by step
Solved in 2 steps with 1 images

Recommended textbooks for you
Linear Algebra: A Modern Introduction
Algebra
ISBN:
9781285463247
Author:
David Poole
Publisher:
Cengage Learning

Glencoe Algebra 1, Student Edition, 9780079039897…
Algebra
ISBN:
9780079039897
Author:
Carter
Publisher:
McGraw Hill
Linear Algebra: A Modern Introduction
Algebra
ISBN:
9781285463247
Author:
David Poole
Publisher:
Cengage Learning
Glencoe Algebra 1, Student Edition, 9780079039897…
Algebra
ISBN:
9780079039897
Author:
Carter
Publisher:
McGraw Hill