A regional express delivery service company recently conducted a study to investigate the relationship between the cost of shipping a package (Y), the package weight (X1), and the distance shipped (X2). Several packages were randomly selected from among the large number received for shipment, and a detailed analysis of the shipping cost was conducted for each package. These sample observations are given in the file P10 22 V2.xlsx + a. Estimate a multiple regression equation using the given data. Cost of shipment - [Select ] [ Select] Weight + ISelect ] * Distance Interpret each of the estimated regression coefficients: · As the weight of the package increases by 1 pound, the [ Select] typically [ Select] by I Select) [ Select] while holding the ( Select] constant. · As the distance shipped increases by 1 mile, the [ Select] typically (Select ] by ISelect ] [ Select ] while holding the (Select ] constant. b. Interpret R2: The R-square value indicates that about [ Select] of the variation in the [ Select] is explained by the multiple regression model. c. The regression model I Select] the sample data well because the p-value of the regression is very [Select]
A regional express delivery service company recently conducted a study to investigate the relationship between the cost of shipping a package (Y), the package weight (X1), and the distance shipped (X2). Several packages were randomly selected from among the large number received for shipment, and a detailed analysis of the shipping cost was conducted for each package. These sample observations are given in the file P10 22 V2.xlsx + a. Estimate a multiple regression equation using the given data. Cost of shipment - [Select ] [ Select] Weight + ISelect ] * Distance Interpret each of the estimated regression coefficients: · As the weight of the package increases by 1 pound, the [ Select] typically [ Select] by I Select) [ Select] while holding the ( Select] constant. · As the distance shipped increases by 1 mile, the [ Select] typically (Select ] by ISelect ] [ Select ] while holding the (Select ] constant. b. Interpret R2: The R-square value indicates that about [ Select] of the variation in the [ Select] is explained by the multiple regression model. c. The regression model I Select] the sample data well because the p-value of the regression is very [Select]

Algebra & Trigonometry with Analytic Geometry
13th Edition
ISBN:9781133382119
Author:Swokowski
Publisher:Swokowski
Chapter7: Analytic Trigonometry
Section7.6: The Inverse Trigonometric Functions
Problem 91E

Related questions
Question
Help me
![A regional express delivery service company recently conducted a study to
investigate the relationship between the cost of shipping a package (Y), the
package weight (X1), and the distance shipped (X2). Several packages were
randomly selected from among the large number received for shipment, and a
detailed analysis of the shipping cost was conducted for each package. These
sample observations are given in the file P10 22 V2.xlsx !
a. Estimate a multiple regression equation using the given data.
Cost of shipment = [ Select)
[ Select]
Weight + [Select]
Distance
Interpret each of the estimated regression coefficients:
· As the weight of the package increases by 1 pound, the
[ Select]
typically ISelect]
by I Select )
[ Select ]
while holding the I Select]
constant.
• As the distance shipped increases by 1 mile, the
[ Select]
typically (Select ]
by [ Select]
[ Select ]
while
holding the [Select ]
constant.
b. Interpret R2: The R-square value indicates that about
[ Select ]
of the variation in the
[ Select]
is explained by the multiple regression
model.
c. The regression model (Select]
the sample data well
because the p-value of the regression is very ( Select]
d. The regression coefficient of X1 (package weight) is
[ Select]
and the regression coefficient of X2 (distance
shipped) is [Select ]
e. What is the expected cost of the shipment for a package that weights 3 Ibs
and needs to be shipped 200 miles away? [ Select]](/v2/_next/image?url=https%3A%2F%2Fcontent.bartleby.com%2Fqna-images%2Fquestion%2Fb96f2eb1-71ac-426b-b908-b8853d447a19%2F29912a80-137d-432b-83bf-ae8a9883699e%2Fk6k44h_processed.png&w=3840&q=75)
Transcribed Image Text:A regional express delivery service company recently conducted a study to
investigate the relationship between the cost of shipping a package (Y), the
package weight (X1), and the distance shipped (X2). Several packages were
randomly selected from among the large number received for shipment, and a
detailed analysis of the shipping cost was conducted for each package. These
sample observations are given in the file P10 22 V2.xlsx !
a. Estimate a multiple regression equation using the given data.
Cost of shipment = [ Select)
[ Select]
Weight + [Select]
Distance
Interpret each of the estimated regression coefficients:
· As the weight of the package increases by 1 pound, the
[ Select]
typically ISelect]
by I Select )
[ Select ]
while holding the I Select]
constant.
• As the distance shipped increases by 1 mile, the
[ Select]
typically (Select ]
by [ Select]
[ Select ]
while
holding the [Select ]
constant.
b. Interpret R2: The R-square value indicates that about
[ Select ]
of the variation in the
[ Select]
is explained by the multiple regression
model.
c. The regression model (Select]
the sample data well
because the p-value of the regression is very ( Select]
d. The regression coefficient of X1 (package weight) is
[ Select]
and the regression coefficient of X2 (distance
shipped) is [Select ]
e. What is the expected cost of the shipment for a package that weights 3 Ibs
and needs to be shipped 200 miles away? [ Select]
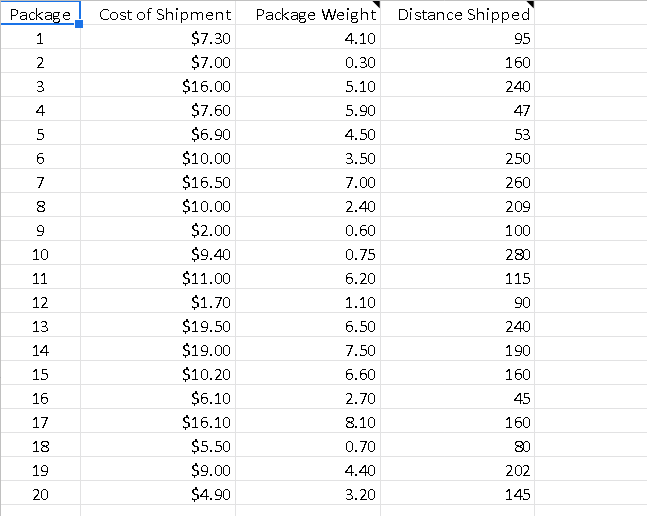
Transcribed Image Text:Package
Cost of Shipment Package Weight Distance Shipped
1
$7.30
4.10
95
2
$7.00
0.30
160
3
$16.00
5.10
240
4
$7.60
5.90
47
$6.90
4.50
53
$10.00
3.50
250
7
$16.50
7.00
260
$10.00
2.40
209
9
$2.00
0.60
100
10
$9.40
0.75
280
11
$11.00
6.20
115
12
$1.70
1.10
90
13
$19.50
6.50
240
14
$19.00
7.50
190
15
$10.20
6.60
160
16
$6.10
2.70
45
17
$16.10
8.10
160
18
$5.50
0.70
80
19
$9.00
4.40
202
20
$4.90
3.20
145
5.
00
Expert Solution
This question has been solved!
Explore an expertly crafted, step-by-step solution for a thorough understanding of key concepts.

This is a popular solution!

Trending now
This is a popular solution!

Step by step
Solved in 2 steps with 3 images

Recommended textbooks for you
Algebra & Trigonometry with Analytic Geometry
Algebra
ISBN:
9781133382119
Author:
Swokowski
Publisher:
Cengage
Algebra & Trigonometry with Analytic Geometry
Algebra
ISBN:
9781133382119
Author:
Swokowski
Publisher:
Cengage