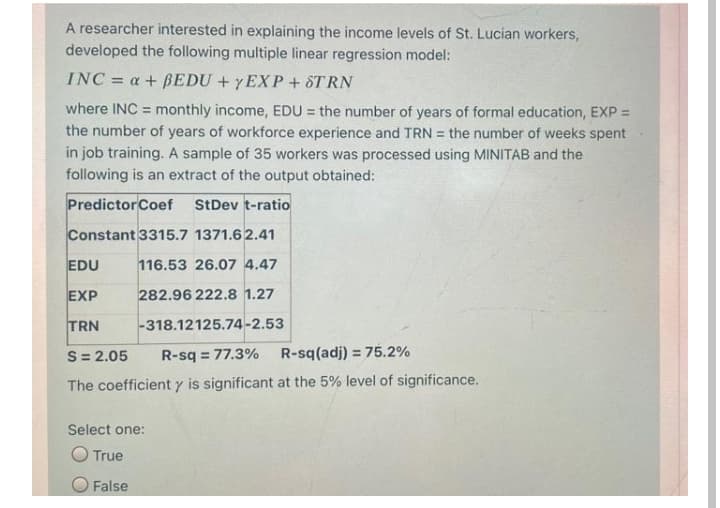
A researcher interested in explaining the income levels of St. Lucian workers, developed the following multiple linear regression model: INC = a+ BEDU +YEXP + STRN %3D where INC = monthly income, EDU = the number of years of formal education, EXP = the number of years of workforce experience and TRN = the number of weeks spent in job training. A sample of 35 workers was processed using MINITAB and the following is an extract of the output obtained: PredictorCoef StDev t-ratio


Correlation
Correlation defines a relationship between two independent variables. It tells the degree to which variables move in relation to each other. When two sets of data are related to each other, there is a correlation between them.
Linear Correlation
A correlation is used to determine the relationships between numerical and categorical variables. In other words, it is an indicator of how things are connected to one another. The correlation analysis is the study of how variables are related.
Regression Analysis
Regression analysis is a statistical method in which it estimates the relationship between a dependent variable and one or more independent variable. In simple terms dependent variable is called as outcome variable and independent variable is called as predictors. Regression analysis is one of the methods to find the trends in data. The independent variable used in Regression analysis is named Predictor variable. It offers data of an associated dependent variable regarding a particular outcome.

Step by step
Solved in 2 steps


