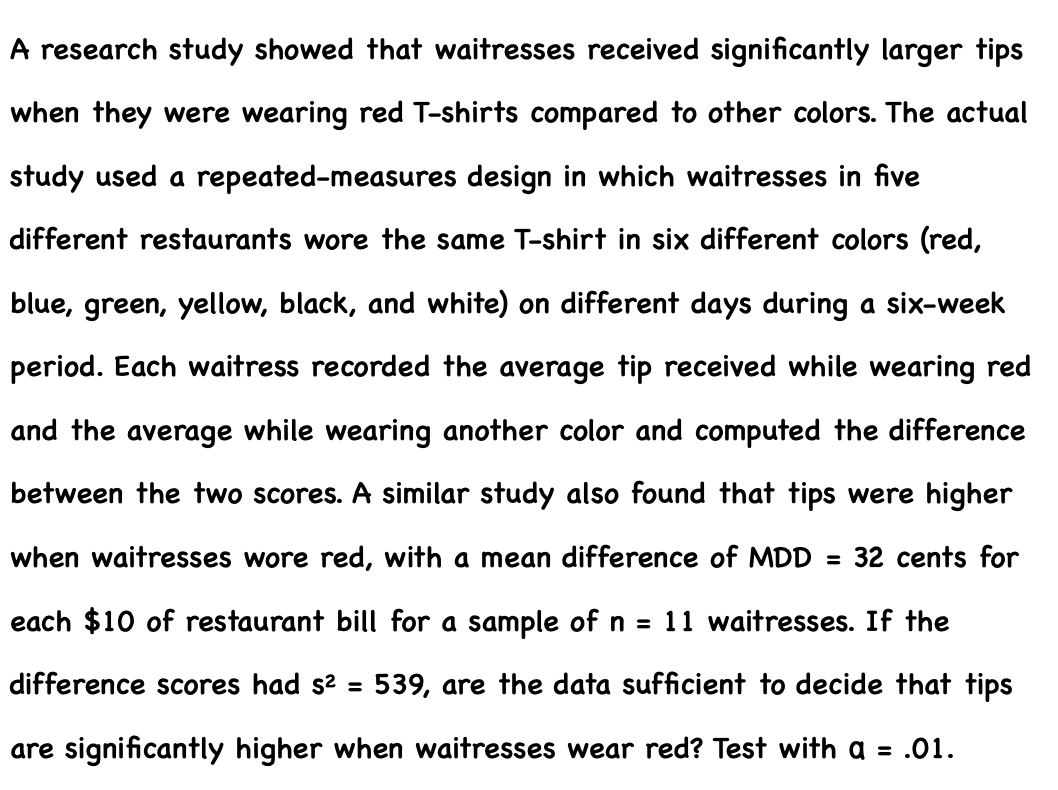
A research study showed that waitresses received significantly larger tips when they were wearing red T-shirts compared to other colors. The actual study used a repeated-measures design in which waitresses in five different restaurants wore the same T-shirt in six different colors (red, blue, green, yellow, black, and white) on different days during a six-week period. Each waitress recorded the average tip received while wearing red and the average while wearing another color and computed the difference between the two scores. A similar study also found that were higher when waitresses wore red, with a mean difference of MDD = 32 cents for each $10 of restaurant bill for a sample of n = 11 waitresses. If the difference scores had s² = 539, are the data sufficient to decide that tips are significantly higher when waitresses wear red? Test with a = .01.
A research study showed that waitresses received significantly larger tips when they were wearing red T-shirts compared to other colors. The actual study used a repeated-measures design in which waitresses in five different restaurants wore the same T-shirt in six different colors (red, blue, green, yellow, black, and white) on different days during a six-week period. Each waitress recorded the average tip received while wearing red and the average while wearing another color and computed the difference between the two scores. A similar study also found that were higher when waitresses wore red, with a mean difference of MDD = 32 cents for each $10 of restaurant bill for a sample of n = 11 waitresses. If the difference scores had s² = 539, are the data sufficient to decide that tips are significantly higher when waitresses wear red? Test with a = .01.

Glencoe Algebra 1, Student Edition, 9780079039897, 0079039898, 2018
18th Edition
ISBN:9780079039897
Author:Carter
Publisher:Carter
Chapter10: Statistics
Section10.6: Summarizing Categorical Data
Problem 10CYU

Related questions

Question
- Formulate the hypotheses.
- Determine the critical value(s).
- Calculate the test statistic.
Transcribed Image Text:A research study showed that waitresses received significantly larger tips
when they were wearing red T-shirts compared to other colors. The actual
study used a repeated-measures design in which waitresses in five
different restaurants wore the same T-shirt in six different colors (red,
blue, green, yellow, black, and white) on different days during a six-week
period. Each waitress recorded the average tip received while wearing red
and the average while wearing another color and computed the difference
between the two scores. A similar study also found that tips were higher
when waitresses wore red, with a mean difference of MDD = 32 cents for
each $10 of restaurant bill for a sample of n = 11 waitresses. If the
difference scores had s? =
539, are the data sufficient to decide that tips
are significantly higher when waitresses wear red? Test with a = .01.
Expert Solution
This question has been solved!
Explore an expertly crafted, step-by-step solution for a thorough understanding of key concepts.

This is a popular solution!

Trending now
This is a popular solution!

Step by step
Solved in 2 steps

Knowledge Booster


Learn more about
Need a deep-dive on the concept behind this application? Look no further. Learn more about this topic, statistics and related others by exploring similar questions and additional content below.Recommended textbooks for you
Glencoe Algebra 1, Student Edition, 9780079039897…
Algebra
ISBN:
9780079039897
Author:
Carter
Publisher:
McGraw Hill

Holt Mcdougal Larson Pre-algebra: Student Edition…
Algebra
ISBN:
9780547587776
Author:
HOLT MCDOUGAL
Publisher:
HOLT MCDOUGAL

College Algebra (MindTap Course List)
Algebra
ISBN:
9781305652231
Author:
R. David Gustafson, Jeff Hughes
Publisher:
Cengage Learning
Glencoe Algebra 1, Student Edition, 9780079039897…
Algebra
ISBN:
9780079039897
Author:
Carter
Publisher:
McGraw Hill
Holt Mcdougal Larson Pre-algebra: Student Edition…
Algebra
ISBN:
9780547587776
Author:
HOLT MCDOUGAL
Publisher:
HOLT MCDOUGAL
College Algebra (MindTap Course List)
Algebra
ISBN:
9781305652231
Author:
R. David Gustafson, Jeff Hughes
Publisher:
Cengage Learning
