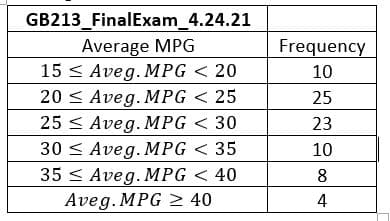
A researcher conducts a mileage economy test involving 80 cars. The frequency distribution describing average miles per gallon (mpg) appears in the following table. (Chart is in image form) (a) What percentage of the cars got 35 mpg or more? (b) Is the distribution symmetric, positively skewed, or negatively skewed?


Q: The number of hospital beds in a sample of 20 hospitals is shown below. Construct a frequency…
A: Obtain the frequency distribution table. The frequency distribution table is obtained below as…
Q: The frequency distribution shown in the following table lists the number of hours per day a randomly…
A:
Q: The data recorded in following Table 4b shows the length of Medical checkup conducted by a Health &…
A: i)Given: The number of classes, k=7. Then, Width=Maximum value-Minimum valuek=1300-37=185.3≃186…
Q: Percentage of People Who Completed 4 or More Years of College Listed by state are the percentages of…
A: Part 1 of 4 Calculate the class width for a frequency distribution with 6 classes The highest value…
Q: In Exercises 5–8, identify the class width, class midpoints, and class boundaries for the given…
A: The table shows the frequency distribution for age (years) of best actress when the Oscar was won…
Q: Percentage of People Who Completed 4 or More Years of College Listed by state are the percentages of…
A:
Q: The frequency distribution shown in the figure lists the number of hours per day a randomly selected…
A:
Q: 1. The list below represents the lifespan (in years) of some of the great/famous painters. 66 46 74…
A: dataset: In stem and leaf plot:
Q: A professor had students keep track of their social interactions for a week. The number of social…
A: Given data,
Q: 3. The average quantitative GRE scores for the top 30 graduate schools of engineering are listed…
A: Here Given data for GRE Score of Top 30 Graduate school of Engineering we will take class Width =10
Q: (a) Complete the frequency distribution for the data. Hours Frequency Relative Frequenc
A:
Q: A researcher is interested in determining if the model used for the distribution of main economic…
A:
Q: People were surveyed about their age and their favorite way to travel for vacation. The results are…
A: From the relative frequency bar chart, it is clear that, majority of children, teens have preferred…
Q: 2. Consider the frequency distribution of exam scores below. Frequency Class 50<60 60<70 5 70<80 14…
A: Hello! As you have posted more than 3 sub parts, we are answering the first 3 sub-parts. In case…
Q: Construct a frequency distribution and a relative frequency histogram for the data set using five…
A:
Q: The range of a given dataset is 12.5, if 7 classes are used to construct a frequency distribution,…
A: Width of each class is approximately 1.79
Q: m oand-whisker plot shows the distribution for three-star hotel rates per night in New York City.…
A:
Q: The data in the table below of Statistics group assignment results (in %) by a random sample of the…
A: “Since you have posted a question with multiple sub-parts, we will solve first three sub-parts for…
Q: he following data represents the age of 30 lottery winners. Given the frequency distribution for…
A:
Q: Construct the cumulative frequency distribution for the given data. Age (years) of Best Actress when…
A: Cumulative frequency for k th class is given by, Fk = f1 +f2 + .... + fk Where, fi = frequency of…
Q: Percentage of People Who Completed 4 or More Years of College Listed by state are the percentages of…
A: Given the data 21.4 26.0 25.3 19.3 29.5 35.0 34.7 26.1 25.8 23.4 27.1 29.2 24.5 29.5 22.1 24.3 28.8…
Q: The data shown here represent the number of miles per gallon that 40 selected four-wheel-drive…
A: we have, data represent the number of miles per gallon that 40 selected four-wheel drive spots…
Q: Construct a frequency distribution and a frequency histogram for the data set using the indicated…
A: Given data is : 427 292 381 338 514 423 388 426 371 311 443 389…
Q: Percentage of People Who Completed 4 or More Years of College Listed by state are the percentages of…
A: When data is given by a set containing the data points, then it is termed as raw data. To analysis…
Q: Construct a frequency distribution and a frequency histogram for the data set using the indicated…
A: Given data, Data 1250 1306 1445 1473 1483 1522 1573 1580 1597 1615 1631…
Q: Listed below are blood groups of O, A, B, and AB of randomly selected blood donors. Construct the…
A:
Q: data in the following frequency distribution table Classes 50 - 70 - 90 - 110 - | 130 - 150 - 170 fi…
A: Hello! As you have posted more than 3 sub parts, we are answering the first 3 sub-parts. In case…
Q: A professor had students keep track of their social interactions for a week. The number of social…
A:
Q: Video game console use: A market research company estimated the numbers of people in various gender…
A: From the provided information, Gender and Age Group Frequency Males 2 – 11 13.6…
Q: Construct a frequency distribution and a relative frequency histogram for the data set using five…
A: we have Ratings from 1 (lowest) to 10(highest) from 36 taste testers for grouping of 5 class.…
Q: In recent years, the three most popular car colors in the United States have been black, silver, and…
A:
Q: A researcher gathered data on hours of video games played by school-aged children and young adults.…
A: Class data 0 - 2 0,1,1,0,2,0,1,0,1,1,2 3 - 5…
Q: The data in the table represent the tuition for all 2-year community colleges in a region in…
A: a) The frequency of a class or observation is the number of values corresponding to it.
Q: Organize the ratio level scores below into a simple frequency distribution table. Include columns…
A: Given data is: 49 52 47 52 52 47 49 47 50 51 50 49 50 50 50 53 51 49
Q: Coffee and Depression: Researchers conducted a study investigating the relationship between…
A: (a) We know that we use the Chi-square test of independence to determine whether there is any…
Q: 1. The scores obtained by 44 students in Grade 10 mathematics test are distributed as follows. Class…
A: To find the class boundaries and cumulative frequency of the given frequency table. Class Boundary:…
Q: Use the frequency distribution to create a histogram with single class values (a bar for 1, a bar…
A: The table shows the frequency distribution.
Q: A researcher is interested in determining if the model used for the distribution of main economic…
A:
Q: The data in the table represent the tuition for all 2-year community colleges in a region in…
A: Note: Hi there! Thank you for posting the question. As there are multiple sub parts, according to…
Q: Construct a frequency distribution and a frequency histogram for the data set using the indicated…
A: number of class =8 lower class value =292 Frequency Distribution Table Class frequency…
Q: The number of hospital beds in a sample of 20 hospitals is shown below. Construct a frequency…
A: Frequency Distribution: In Statistical theory, a frequency distribution is a tabular, listed or…
Q: 4. A sporting goods store kept a record of sales of five items for one randomly selected hour during…
A:
Q: In Exercises 5–8, identify the class width, class midpoints, and class boundaries for the given…
A: The table shows the frequency distribution for the blood platelet count of females with their…
Q: 5. Approximate the mean, median and the mode of the frequency distribution table below. CLASSES CM…
A: classes f CF mid-value(x) f.x -0.5-9.5 1 1 4.5 4.5 9.5-19.5 2 3 14.5 29 19.5-29.5 1 4…
Q: In Exercises 5–8, identify the class width, class midpoints, and class boundaries for the given…
A: Class width:The class width is the distance between two successive lower limits of class…
Q: The data set below contains information about the pulse rates of students in a class. Use the data…
A: Here 6 classes are required. To construct the classes, let's find the class width. In the given…
Q: The preschool children at Elmwood Elementary School were asked to name their favorite color. The…
A: Given : blue blue purple yellow green green green blue green purple…
Q: Construct a relative frequency distribution of the data.
A: Given: Response Frequency, f Las Vegas 1268 Orlando 814 New York 1148 Chicago 539 San…
Q: 3.7 Make a stemplot. Here are the scores on the first exam in an introductory statistics course for…
A: Stem and leaf plot. The stems are listed in the left side of the vertical line and these numbers…
Q: The Affordable Care Act created a market place for individuals to purchase health care plans. A…
A: Given data: $138 $238 $282 $254 $223 $275 $180 $194 $220 $228 $198 $178 $289 $162 $181 $126 $138…
-
A researcher conducts a mileage economy test involving 80 cars. The frequency distribution describing average miles per gallon (mpg) appears in the following table.
(Chart is in image form)
(a) What percentage of the cars got 35 mpg or more?
(b) Is the distribution symmetric, positively skewed, or negatively skewed?


Trending now
This is a popular solution!

Step by step
Solved in 3 steps with 1 images

- The PR team at Bruno conducts their hiring process in two stages. For applicants who are classified as A, B, and G in the first stage, the chances of getting hired full-time after the second stage are 74%, 43% and 26% respectively. If an applicant is not hired full-time, they are either put on a probation list, or rejected. Unselected applicants of all categories (A, B, and G) are half as likely to be put on the probation list as being rejected. During the first stage of the most recent hiring, 22% of the applicants were rated A, 39% were rated B, and the rest were rated G. If a randomly chosen applicant was rejected by three out of eight individual interviewers, what is the probability that they were rated A?In 20162016, the Chicago Cubs defeated the Cleveland Indians to become the champions of Major League Baseball. Following are the salaries, in millions of dollars, of the players on each of these teams. Cubs20.0012.009.508.808.057.755.695.293.632.672.532.512.500.650.540.530.530.520.520.520.510.510.510.510.51Cubs20.005.290.540.5112.003.630.530.519.502.670.530.518.802.530.520.518.052.510.527.752.500.525.690.650.51Kentville, a community of 10,000 people, resides next to a krypton mine, and there is a concern that the emission from the krypton smelter have resulted in adverse effects. Specifically, Kryptonosis seems to have killed 12 of Kentville’s inhabitants last year. A neighboring community, Lanesburg, has 25,000 inhabitants and is far enough from the smelter to not be affected by the emission. In Lanesburg, only three people last year died of Kryptonosis. Given that the number of deaths in Kentville and their causes last year were: Heart attack=7 Accidents=4 Kryptonosis=12 Other=6 What is the risk of dying of Kryptonosis in Kentville relative to non-contaminated locality?What is the risk of dying of Kryptonosis in Kentville relative to deaths due to other causes? How many times the chance of dying of Kryptonosis compared to dying of accidents ? How many times the chance of dying of Kryptonosis compared to Other causes?
- An insurance company offers four different deductible levels—none, low, medium, and high—for its homeowner’s policyholders and three different levels—low, medium, and high—for its automobile policyholders. The accompanying table gives proportions for the various categories of policyholders who have both types of insurance. For example, theproportion of individuals with both low homeowner’s deductible and low auto deductible is .06 (6% of all such individuals).Suppose an individual having both types of policies is randomly selected.a. What is the probability that the individual has a medium auto deductible and a high homeowner’s deductible?b. What is the probability that the individual has a low auto deductible? A low homeowner’s deductible?c. What is the probability that the individual is in the same category for both auto and homeowner’s deductibles?d. Based on your answer in part (c), what is the probability that the two categories are different?e. What is the probability that the…The television show CSI: Shoboygan has been successful for many years. That show recently had a share of 19, which means, that among the TV sets in use, 19% were tuned to CSI: Shoboygan. An advertiser wants to verify that 19% share value by conducting its own survey, and a pilot survey begins with 12 households have TV sets in use at the time of a CSI: Shoboygan broadcast.A cohort study was conducted over five years among 200 trial attorneys and general practice attorneys after stringent tort law reform, to see how many would develop heart conditions over time. In total, 50 attorneys developed heart disease. It was found that 40 who developed disease practiced trial law, while 10 who developed disease did not practice trial law. One hundred (100) who did not develop disease also did not practice trial law, and 50 who did not develop disease practiced trial law. Set up the 2 x 2 table and calculate the appropriate rate of risk
- An auto insurance company classifies each motorist as "high risk" if the motorist has had at least one moving violation during the past calendar year and "low risk" if the motorist has had no violations during the past calendar year. According to the company's data, a high-risk motorist has a 50% chance of remaining in the high-risk category the next year and a 50% chance of moving to the low-risk category. A low-risk motorist has a 90% chance of moving to the high-risk category the next year and a 10% chance of remaining in the low-risk category. In the long term, what percentage of motorists fall in each category? (Round your answers to two decimal places.) high-risk category% low-risk category %An auto insurance company classifies each motorist as "high risk" if the motorist has had at least one moving violation during the past calendar year and "low risk" if the motorist has had no violations during the past calendar year. According to the company's data, a high-risk motorist has a 50% chance of remaining in the high-risk category the next year and a 50% chance of moving to the low-risk category. A low-risk motorist has a 70% chance of moving to the high-risk category the next year and a 30% chance of remaining in the low-risk category. In the long term, what percentage of motorists fall in each category? (Round your answers to two decimal places.)Governor Andy Beshear stated that COVID-19 is disproportionately affecting the AfricanAmerican community in Kentucky. As of April 21, there are 144 deaths from COVID-19 where the race of the patient is known, and of those 20 are African-American. AfricanAmericans make up 8% of the population of Kentucky overall. Does this information indicate that African-Americans in Kentucky are dying from COVID-19 at a disproportionate rate? Use an α = 0.05 significance level to test this claim. (d) What is the P-value?(e) Write a brief summary of your conclusion.
- A seven-year medical research study reported that women whose mothers took the drugDES during pregnancy were twice as likely to develop tissue abnormalities that might leadto cancer as were women whose mothers did not take the drug.a. This study compared two populations. What were the populations?b. Do you suppose the data were obtained in a survey or an experiment?c. For the population of women whose mothers took the drug DES during pregnancy, asample of 3980 women showed that 63 developed tissue abnormalities that might leadto cancer. Provide a descriptive statistic that could be used to estimate the number ofwomen out of 1000 in this population who have tissue abnormalities.d. For the population of women whose mothers did not take the drug DES duringpregnancy, what is the estimate of the number of women out of 1000 who would beexpected to have tissue abnormalities?A seven-year medical research study reported that women whose mothers took the drugDES during pregnancy were twice as likely to develop tissue abnormalities that might leadto cancer as were women whose mothers did not take the drug.a. This study compared two populations. What were the populations?b. Do you suppose the data were obtained in a survey or an experiment?c. For the population of women whose mothers took the drug DES during pregnancy, asample of 3980 women showed that 63 developed tissue abnormalities that might leadto cancer. Provide a descriptive statistic that could be used to estimate the number ofwomen out of 1000 in this population who have tissue abnormalitiesFor a telephone survey, a marketing research group needs to contact at least 600 wives, 480 husbands, 400 single adult males, and 440 single adult females. It costs $3 to make a daytime call and (because of higher labor costs) $5 to make an evening call. The file P03_31.xlsx lists the results that can be expected. For example, 30% of all daytime calls are answered by a wife, 15% of all evening calls are answered by a single male, and 40% of all daytime calls are not answered at all. Due to limited staff, at most 40% of all phone calls can be evening calls. a. Determine how to minimize the cost of completing the survey. b. Use SolverTable to investigate changes in the unit cost of either type of call. Specifically, investigate changes in the cost of a daytime call, with the cost of an evening call fixed, to see when (if ever) only daytime calls or only evening calls will be made. Then repeat the analysis by changing the cost of an evening call and keeping the cost of a daytime call…