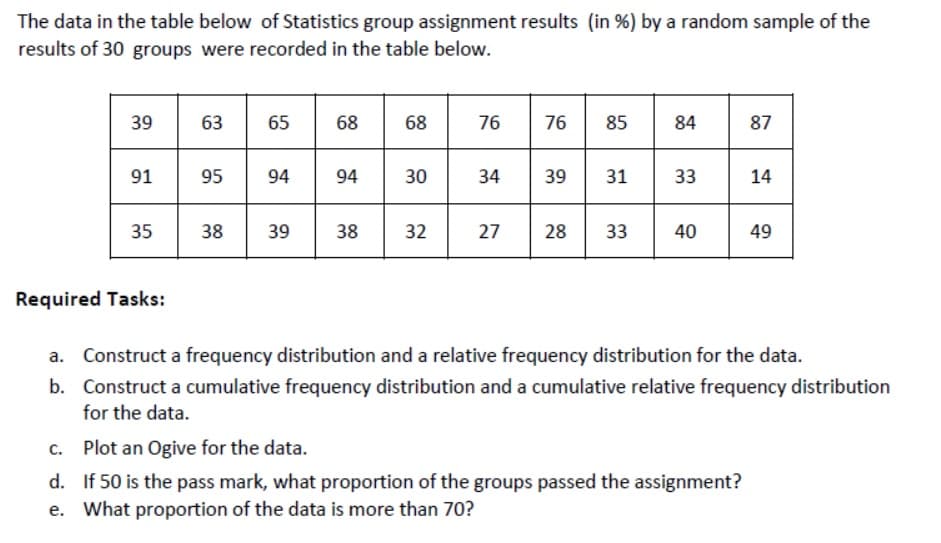
The data in the table below of Statistics group assignment results (in %) by a random sample of the results of 30 groups were recorded in the table below. 39 63 65 68 68 76 76 85 84 87 91 95 94 94 30 34 39 31 33 14 35 38 39 38 32 27 28 33 40 49 Required Tasks: a. Construct a frequency distribution and a relative frequency distribution for the data. b. Construct a cumulative frequency distribution and a cumulative relative frequency distribution for the data. c. Plot an Ogive for the data. d. If 50 is the pass mark, what proportion of the groups passed the assignment? e. What proportion of the data is more than 70?
The data in the table below of Statistics group assignment results (in %) by a random sample of the results of 30 groups were recorded in the table below. 39 63 65 68 68 76 76 85 84 87 91 95 94 94 30 34 39 31 33 14 35 38 39 38 32 27 28 33 40 49 Required Tasks: a. Construct a frequency distribution and a relative frequency distribution for the data. b. Construct a cumulative frequency distribution and a cumulative relative frequency distribution for the data. c. Plot an Ogive for the data. d. If 50 is the pass mark, what proportion of the groups passed the assignment? e. What proportion of the data is more than 70?

MATLAB: An Introduction with Applications
6th Edition
ISBN:9781119256830
Author:Amos Gilat
Publisher:Amos Gilat
Chapter1: Starting With Matlab
Section: Chapter Questions
Problem 1P

Related questions

Topic Video
Question
Transcribed Image Text:The data in the table below of Statistics group assignment results (in %) by a random sample of the
results of 30 groups were recorded in the table below.
39
63
65
68
68
76
76
85
84
87
91
95
94
94
30
34
39
31
33
14
35
38
39
32
27
28
40
Required Tasks:
a. Construct a frequency distribution and a relative frequency distribution for the data.
b. Construct a cumulative frequency distribution and a cumulative relative frequency distribution
for the data.
c. Plot an Ogive for the data.
d. If 50 is the pass mark, what proportion of the groups passed the assignment?
e. What proportion of the data is more than 70?
Expert Solution
This question has been solved!
Explore an expertly crafted, step-by-step solution for a thorough understanding of key concepts.

Step by step
Solved in 2 steps with 1 images

Knowledge Booster


Learn more about
Need a deep-dive on the concept behind this application? Look no further. Learn more about this topic, statistics and related others by exploring similar questions and additional content below.Recommended textbooks for you
MATLAB: An Introduction with Applications
Statistics
ISBN:
9781119256830
Author:
Amos Gilat
Publisher:
John Wiley & Sons Inc

Probability and Statistics for Engineering and th…
Statistics
ISBN:
9781305251809
Author:
Jay L. Devore
Publisher:
Cengage Learning

Statistics for The Behavioral Sciences (MindTap C…
Statistics
ISBN:
9781305504912
Author:
Frederick J Gravetter, Larry B. Wallnau
Publisher:
Cengage Learning
MATLAB: An Introduction with Applications
Statistics
ISBN:
9781119256830
Author:
Amos Gilat
Publisher:
John Wiley & Sons Inc
Probability and Statistics for Engineering and th…
Statistics
ISBN:
9781305251809
Author:
Jay L. Devore
Publisher:
Cengage Learning
Statistics for The Behavioral Sciences (MindTap C…
Statistics
ISBN:
9781305504912
Author:
Frederick J Gravetter, Larry B. Wallnau
Publisher:
Cengage Learning

Elementary Statistics: Picturing the World (7th E…
Statistics
ISBN:
9780134683416
Author:
Ron Larson, Betsy Farber
Publisher:
PEARSON

The Basic Practice of Statistics
Statistics
ISBN:
9781319042578
Author:
David S. Moore, William I. Notz, Michael A. Fligner
Publisher:
W. H. Freeman

Introduction to the Practice of Statistics
Statistics
ISBN:
9781319013387
Author:
David S. Moore, George P. McCabe, Bruce A. Craig
Publisher:
W. H. Freeman