4. A sporting goods store kept a record of sales of five items for one randomly selected hour during a recent sale. Construct a frequency distribution for the data (B = baseballs, G Golf balls, T = Tennis balls, S Soccer balls, F= footballs). B F F S G F S. S. I.
4. A sporting goods store kept a record of sales of five items for one randomly selected hour during a recent sale. Construct a frequency distribution for the data (B = baseballs, G Golf balls, T = Tennis balls, S Soccer balls, F= footballs). B F F S G F S. S. I.

Glencoe Algebra 1, Student Edition, 9780079039897, 0079039898, 2018
18th Edition
ISBN:9780079039897
Author:Carter
Publisher:Carter
Chapter10: Statistics
Section10.6: Summarizing Categorical Data
Problem 10CYU

Related questions
Question
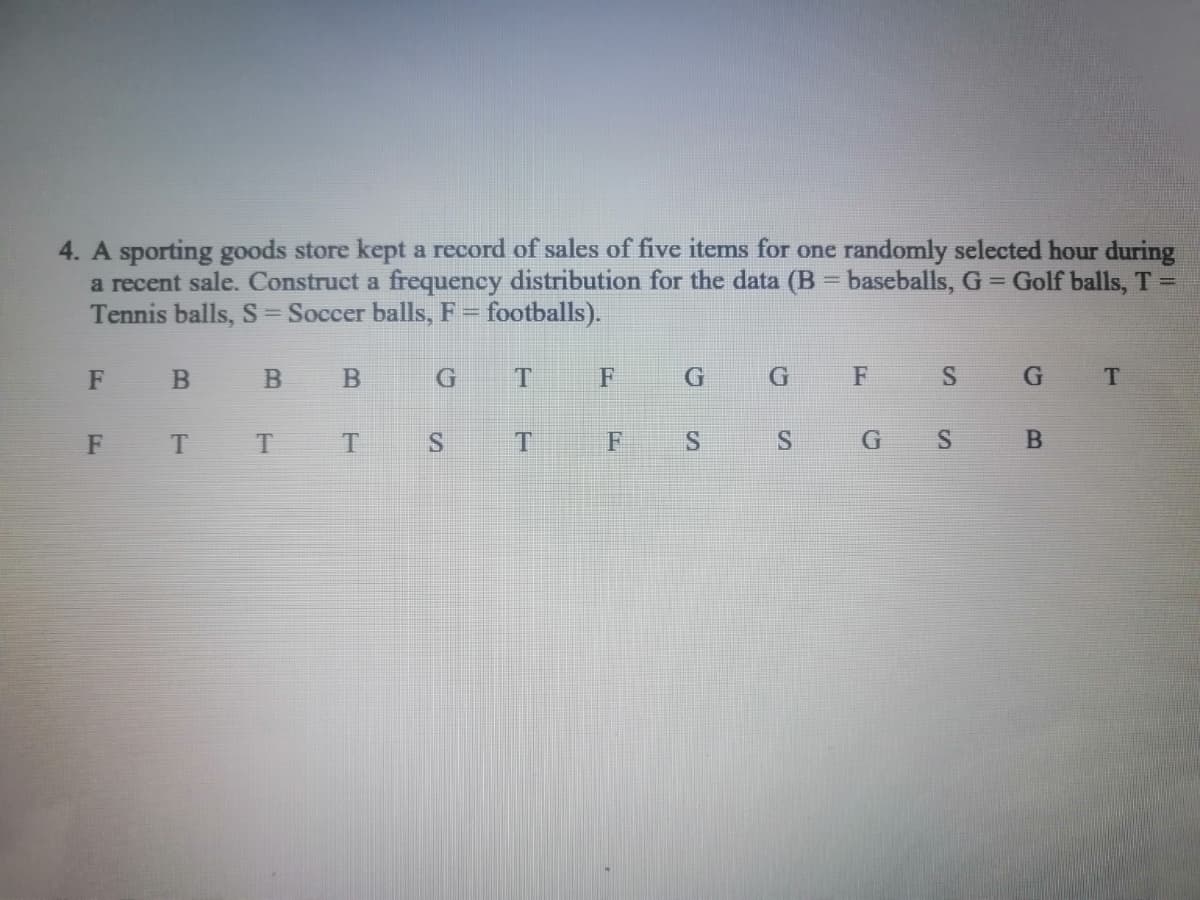
Transcribed Image Text:4. A sporting goods store kept a record of sales of five items for one randomly selected hour during
a recent sale. Construct a frequency distribution for the data (B = baseballs, G Golf balls, T =
Tennis balls, S= Soccer balls, F= footballs).
%3D
B
F
F T
T.
SI
SI
SI
Expert Solution
This question has been solved!
Explore an expertly crafted, step-by-step solution for a thorough understanding of key concepts.

This is a popular solution!

Trending now
This is a popular solution!

Step by step
Solved in 2 steps with 2 images

Recommended textbooks for you
Glencoe Algebra 1, Student Edition, 9780079039897…
Algebra
ISBN:
9780079039897
Author:
Carter
Publisher:
McGraw Hill
Glencoe Algebra 1, Student Edition, 9780079039897…
Algebra
ISBN:
9780079039897
Author:
Carter
Publisher:
McGraw Hill