A researcher is examining the relationship between stress levels and performance on a test of cognitive performance. She hypothesizes that stress levels lead to an increase in performance to a point, and then increased stress decreases performance. She tests 10 participants who have the following levels of stress: 10.94 12.76 7.62 8.17 7.83 12.22 9.23 11.17 11.88 8.18 When she tests their levels of mental performance, she finds the following cognitive performance scores (listed in the same participant order as above): 5.24 4.64 4.68 5.04 4.17 6.20 4.54 6.55 5.79 3.17 Perform a linear regression to examine the relationship between these variables. What do the results mean?
A researcher is examining the relationship between stress levels and performance on a test of cognitive performance. She hypothesizes that stress levels lead to an increase in performance to a point, and then increased stress decreases performance. She tests 10 participants who have the following levels of stress: 10.94 12.76 7.62 8.17 7.83 12.22 9.23 11.17 11.88 8.18 When she tests their levels of mental performance, she finds the following cognitive performance scores (listed in the same participant order as above): 5.24 4.64 4.68 5.04 4.17 6.20 4.54 6.55 5.79 3.17 Perform a linear regression to examine the relationship between these variables. What do the results mean?

Chapter3: Polynomial Functions
Section3.5: Mathematical Modeling And Variation
Problem 2ECP

Related questions
Question
A researcher is examining the relationship between stress levels and performance on a test of cognitive performance. She hypothesizes that stress levels lead to an increase in performance to a point, and then increased stress decreases performance. She tests 10 participants who have the following levels of stress:
10.94
12.76
7.62
8.17
7.83
12.22
9.23
11.17
11.88
8.18
When she tests their levels of mental performance, she finds the following cognitive performance scores (listed in the same participant order as above):
5.24
4.64
4.68
5.04
4.17
6.20
4.54
6.55
5.79
3.17
Perform a linear regression to examine the relationship between these variables. What do the results mean?
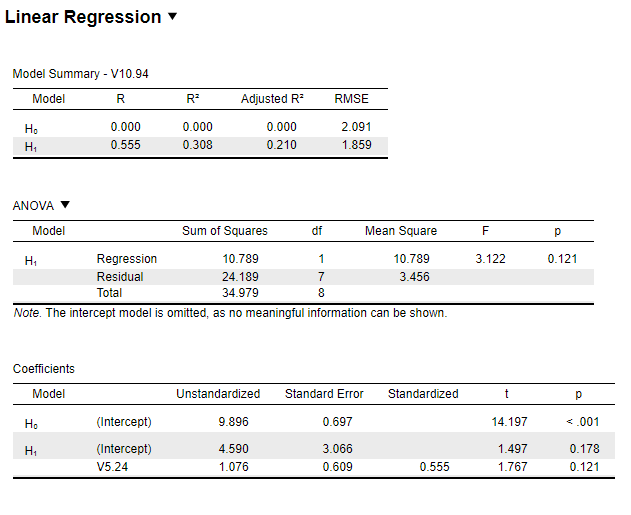
Transcribed Image Text:Linear Regression
Model Summary - V10.94
Model
R
Adjusted R
RMSE
H.
0.000
0.000
0.000
2.091
H1
0.555
0.308
0.210
1.859
ANOVA V
Model
Sum of Squares
df
Mean Square
H1
Regression
10.789
1
10.789
3.122
0.121
Residual
24.189
3.456
Total
34.979
8
Note. The intercept model is omitted, as no meaningful information can be shown.
Coefficients
Model
Unstandardized
Standard Error
Standardized
Но
(Intercept)
9.896
0.697
14.197
<.001
H1
(Intercept)
4.590
3.066
1.497
0.178
V5.24
1.076
0.609
0.555
1.767
0.121
Expert Solution
This question has been solved!
Explore an expertly crafted, step-by-step solution for a thorough understanding of key concepts.

This is a popular solution!

Trending now
This is a popular solution!

Step by step
Solved in 2 steps with 2 images

Recommended textbooks for you

Functions and Change: A Modeling Approach to Coll…
Algebra
ISBN:
9781337111348
Author:
Bruce Crauder, Benny Evans, Alan Noell
Publisher:
Cengage Learning

Algebra and Trigonometry (MindTap Course List)
Algebra
ISBN:
9781305071742
Author:
James Stewart, Lothar Redlin, Saleem Watson
Publisher:
Cengage Learning
Functions and Change: A Modeling Approach to Coll…
Algebra
ISBN:
9781337111348
Author:
Bruce Crauder, Benny Evans, Alan Noell
Publisher:
Cengage Learning
Algebra and Trigonometry (MindTap Course List)
Algebra
ISBN:
9781305071742
Author:
James Stewart, Lothar Redlin, Saleem Watson
Publisher:
Cengage Learning

Elementary Linear Algebra (MindTap Course List)
Algebra
ISBN:
9781305658004
Author:
Ron Larson
Publisher:
Cengage Learning

Algebra & Trigonometry with Analytic Geometry
Algebra
ISBN:
9781133382119
Author:
Swokowski
Publisher:
Cengage

College Algebra
Algebra
ISBN:
9781305115545
Author:
James Stewart, Lothar Redlin, Saleem Watson
Publisher:
Cengage Learning