A researcher wanted to determine if carpeted rooms contain more bacteria than uncarpeted rooms. The table shows the results for the number of bacteria per cubic foot for both types of rooms. Full data se Carpeted 10.9 13.7 Uncarpeted 10.2 15.9 10.1 5.7 9.2 10.1 12.4 15.3 11.3 7.8 13.6 14 Determine whether carpeted rooms have more bacteria than uncarpeted rooms at the a =0.05 level of significance. Normal probability plots indicate that the data are approximately normal and boxplots indicate that there are no outliers. State the null and alternative hypotheses. Let population 1 be carpeted rooms and population 2 be uncarpeted rooms. O A. Ho: H1 = H2 H: H1
A researcher wanted to determine if carpeted rooms contain more bacteria than uncarpeted rooms. The table shows the results for the number of bacteria per cubic foot for both types of rooms. Full data se Carpeted 10.9 13.7 Uncarpeted 10.2 15.9 10.1 5.7 9.2 10.1 12.4 15.3 11.3 7.8 13.6 14 Determine whether carpeted rooms have more bacteria than uncarpeted rooms at the a =0.05 level of significance. Normal probability plots indicate that the data are approximately normal and boxplots indicate that there are no outliers. State the null and alternative hypotheses. Let population 1 be carpeted rooms and population 2 be uncarpeted rooms. O A. Ho: H1 = H2 H: H1

Linear Algebra: A Modern Introduction
4th Edition
ISBN:9781285463247
Author:David Poole
Publisher:David Poole
Chapter7: Distance And Approximation
Section7.3: Least Squares Approximation
Problem 31EQ

Related questions
Question
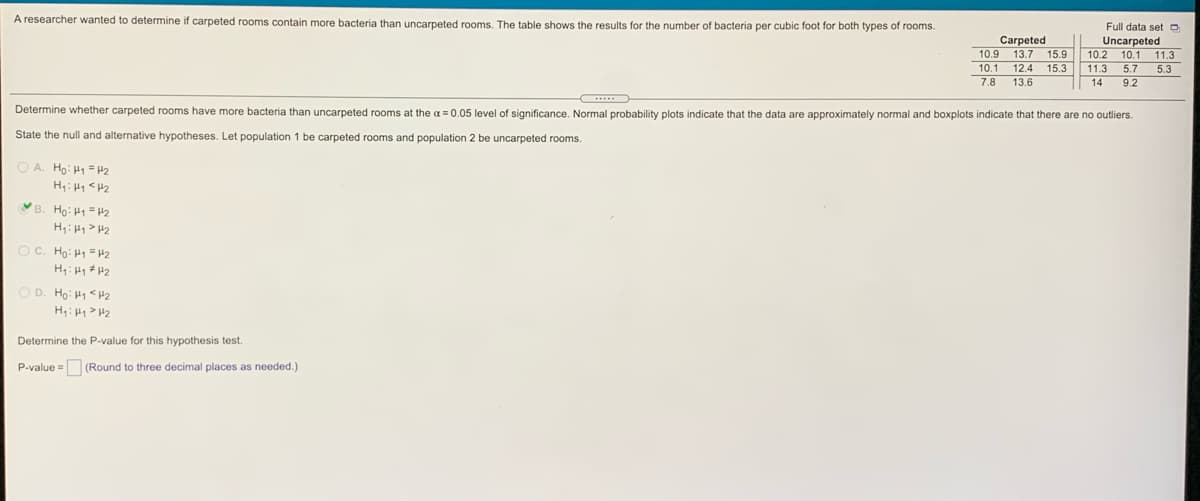
Transcribed Image Text:A researcher wanted to determine if carpeted rooms contain more bacteria than uncarpeted rooms. The table shows the results for the number of bacteria per cubic foot for both types of rooms.
Full data set o
Carpeted
10.9 13.7
10.1 12.4
7.8
Uncarpeted
10.2
10.1 11.3
15.9
15.3
5.3
11.3
5.7
9.2
13.6
14
Determine whether carpeted rooms have more bacteria than uncarpeted rooms at the a =0.05 level of significance. Normal probability plots indicate that the data are approximately normal and boxplots indicate that there are no outliers.
State the null and alternative hypotheses. Let population 1 be carpeted rooms and population 2 be uncarpeted rooms.
O A. Ho: H1 = H2
H: H1 <H2
B. Ho: H1= H2
H;: H1> H2
O C. Ho: H1 = H2
D. Ho: H1 <H2
H: H1> H2
Determine the P-value for this hypothesis test.
P-value = (Round to three decimal places as needed.)
Expert Solution
This question has been solved!
Explore an expertly crafted, step-by-step solution for a thorough understanding of key concepts.

Step by step
Solved in 2 steps with 2 images

Recommended textbooks for you
Linear Algebra: A Modern Introduction
Algebra
ISBN:
9781285463247
Author:
David Poole
Publisher:
Cengage Learning

Glencoe Algebra 1, Student Edition, 9780079039897…
Algebra
ISBN:
9780079039897
Author:
Carter
Publisher:
McGraw Hill

Functions and Change: A Modeling Approach to Coll…
Algebra
ISBN:
9781337111348
Author:
Bruce Crauder, Benny Evans, Alan Noell
Publisher:
Cengage Learning
Linear Algebra: A Modern Introduction
Algebra
ISBN:
9781285463247
Author:
David Poole
Publisher:
Cengage Learning
Glencoe Algebra 1, Student Edition, 9780079039897…
Algebra
ISBN:
9780079039897
Author:
Carter
Publisher:
McGraw Hill
Functions and Change: A Modeling Approach to Coll…
Algebra
ISBN:
9781337111348
Author:
Bruce Crauder, Benny Evans, Alan Noell
Publisher:
Cengage Learning

Big Ideas Math A Bridge To Success Algebra 1: Stu…
Algebra
ISBN:
9781680331141
Author:
HOUGHTON MIFFLIN HARCOURT
Publisher:
Houghton Mifflin Harcourt