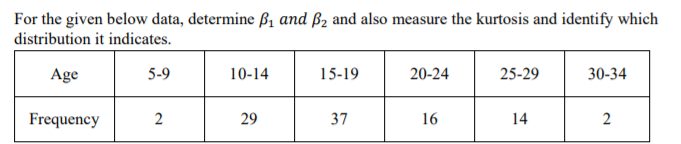
For the given below data, determine ß1 and ß2 and also measure the kurtosis and identify which distribution it indicates. Age 5-9 10-14 15-19 20-24 25-29 30-34 Frequency 2 29 37 16 14 2


Q: data Shown to the right for the dependent variable, y, and the independent variable, x, have been…
A:
Q: Here is a bivariate data set. y 53.4 78.8 59.5 54.6 56.7 70 56.1 65 58.7 46.9 52.2 86.7 66 48.5 71.6…
A: Procedure: Enter the data in the SPSS sheet. select the data then go to the analyze option. Select…
Q: The table below shows the frequency distribution of the rainfall on 52 consecutive Mondays in a…
A: class frequency 0.00-0.19 23 0.20-0.39 11 0.40-0.59 6 0.60-0.79 2 0.80-0.99 6…
Q: The data shown to the right for the dependent variable, y, and the independent variable, x, have…
A: Given data, X Y X*Y X*X Y*Y 12 80 960 144 6400 14 40 560 196 1600 10 70 700 100 4900 14…
Q: The data shown to the right for the dependent variable, y, and the independent variable, x, have…
A: According to the above data, We can the value of X and Y we plot X on X axis and Y on Y axis. And…
Q: Determine if the process is in control or not, using the western electric rules. Next to each…
A: Consider the first process: Scatter plot: Lower Control Limit (LCL) < 5 Upper Control Limit…
Q: Here is a bivariate data set. y 105 16 17 90 25 131 40 91 21 68 32 120 20 73 27 56 Find the…
A: Step-by-step procedure to find the correlation coefficient using Excel: In Excel sheet, enter X in…
Q: Answer the correlation questions using the data below. Use α = 0.01. X Y 9 1 6 0 8 1 3 0…
A:
Q: How much should a healthy Shetland pony weigh? Let x be the age of the pony (in months), and let y…
A: Procedure to draw scatterplot using Excel: Enter the data in an Excel sheet. Select the data and…
Q: Consider the data set given below. Data Table x1 x2…
A: Entries [joint frequencies] in the total row and total column in two-way frequency table are called…
Q: The following data give the distance (in miles) byroad and the straight line (shortest) distance,…
A: From the provided information, The table can be constructed as: X Y XY X2 Y2 13 10…
Q: Based on the data shown below, calculate the correlation coefficient (to three decimal places) y 5.6…
A: Correlation coefficient: We have n = 9
Q: For the data below, compute the Pearson correlation. X Y 3 4 2 5 1 9 6 2 Find coefficient of…
A:
Q: In the stem-and-leaf display given below you can find the amount of solvent used in Kg (with leaves…
A: The probability is computed by using the formula,
Q: Here are the ages of 50 pennies, calculaced as AGE = CURRENT VEAR - VEAR ON PENNY. The data have…
A: Hi! Thank you for the question, As per the honour code, we are allowed to answer three sub-parts at…
Q: The weights (in pounds) of 6 vehicles and the variability of their braking distances (in feet) when…
A: Given that
Q: The Number of Advertisements and Sales in OMR in thousands are given below. Find out the Pearson's…
A:
Q: Given the histogram shown below, what is the relative frequency of shrubs equal to or shorter than 1…
A: From the given bar chart the relative frequency for the interval 0-0.5 is 0.4 and that for the…
Q: Use the given data set to complete parts (a) through (b) below. (Use a 0 05) 10 914 13 874 11 9.26…
A:
Q: the given data set to complete parts (a) through (c) below. (Use α=0.05.) x 10 8 13 9 11 14 6…
A: a. The scatter plot is obtained using EXCEL. The software procedure is given below: Enter the data.…
Q: Here is a bivariate data set. y 61.9 22.3 38.4 64.6 66.7 0.4 62.1 -13 42.6 69.1 Find the correlation…
A: Correlation coefficient: Correlation is the statistical measure that shows the relation between two…
Q: a.Two instruments are used to measure enzyme activity by colorimetry. You want to know if the…
A: Given: A B 0.86 0.87 0.82 0.74 0.75 0.63 0.61 0.55 0.89 0.76 0.64 0.7 0.81 0.69…
Q: Use the given data below. x y 2.3 3.9 4 1.4 2.9 3.5 4.7…
A: x y x^2 y^2 xy 2.3 3.9 5.29 15.21 8.97 4 1.4 16 1.96 5.6 2.9 3.5 8.41 12.25 10.15 4.7 5…
Q: The data shown to the right for the dependent variable, y, and the independent variable, x, have…
A: The independent variable is x. The dependent variable is y. The given data represents simple linear…
Q: The weights (in pounds) of 6 vehicles and the variability of their braking distances (in feet) when…
A: Correlation coefficient : Correlation coefficient is used to measures strength of the association…
Q: The data shown to the right for the dependent variable, y, and the independent variable, x, have…
A: The data with dependant variable y and the independent variables x have been collected using simple…
Q: The weights (in pounds) of 6 vehicles and the variability of their braking distances (in feet) when…
A:
Q: The data shown to the right for the dependent variable, y, and the independent variable, x, have…
A: The independent variable is x. The dependent variable is y. The given data represents simple linear…
Q: Here is a bivariate data set. y 20 61 26 61 19 57 25 48 31 48 24 42 36 35 Find the correlation…
A: Given,
Q: The following data represent the concentration of dissolved organic carbon (mg/L) collected from 20…
A:
Q: Exposure to microbial products, especially endotoxin, may have an impact on vulnerability to…
A:
Q: Use the given data set to complete parts (a) through (c) below. (Use α=0.05.) x 10 8 13 9 11…
A: (a) Use EXCEL to construct the scatter plot. EXCEL procedur: Go to EXCEL Go to Insert menu Select…
Q: Based on the data shown below, calculate the correlation coefficient (rounded to three decimal…
A: Given,
Q: The data shown to the right for the dependent variable, y, and the independent variable, x, have…
A: The independent variable is x. The dependent variable is y. The given data represents simple linear…
Q: calcium is essential to tree growth because it promotes the formation of wood maintains cell walls.…
A:
Q: Which of the following samples will produce the largest value for a t statistic? Solect one: a. D =…
A: We have to identify true option.
Q: Based on the data shown below, calculate the correlation coefficient (to three decimal places) y…
A: correlation Coefficient is determined as shown below
Q: Based on the data shown below, calculate the correlation coefficient (rounded to three decimal…
A: Question 1
Q: Use the data to the right to complete parts (a) through (d) below. Percentage Who Won't Try Don't…
A: Given that; A data set is here By using the formula of correlation coefficient (r)and regression…
Q: Or 0.870 b) r = -0.951 r = 0.126 e) r= 0.979 f) r = –0.823
A: a). r=0.870 Since r is less than 0.9 but greater than 0.6 and has a positive sign therefore there is…
Q: average weight of the pony (in kilograms). Suppose a random sample of ponies gave the following…
A:
Q: Based on the data shown below, calculate the correlation coefficient r (to three decimal places) y…
A:
Q: The following data are the temperature of effluent at discharge from a sewage facility on…
A: The given data represents the effluent temperature at discharge from a sewage facility.
Q: In the stem-and-leaf display given below you can find the amount of solvent used in Kg (with leaves…
A: First let us create a grouped frequency table with "9.0 but less than 10.0 Kg" as the first class.…
Q: Use the given data set to complete parts (a) through (c) below. (Use a= 0.05.) 12 9.14 6 4 11 9.27…
A: a) The scatter plot is Therefore, option d) is correct.
Q: Find the following measures of dispersion using the following lists of average month temperatures of…
A: a) The data set with largest standard deviation having the more variability. Consider, the standard…
Q: The weights (in pounds) of 6 vehicles and the variability of their braking distances (in feet)…
A: Linear correlation coefficient: Use the EXCEL formula, "=CORREL(A2:A7,B2:B7)". The value obtained is…
Q: Let x be the average number of employees in a group health insurance plan, and let y be the average…
A:
Q: The Number of Advertisements and Sales in OMR in thousands are given below. Find out the Pearson's…
A:
Q: The data shown to the right for the dependent variable, y, and the independent variable, x, have…
A: Given: The data are arranged in a ascending order. X Y 10 100 11 110 11 120 12 140 13…

Step by step
Solved in 2 steps

- The aging Neotropical termites (Neocapritermes taracua) secrete a sticky, blue-colored liquid that they spew to intruding termites. The younger Neotropical termites secrete a liquid that lacks the blue component, so it is white in appearance. In an experiment that measured the toxicity of the blue substance, the researchers placed one drop of either the blue liquid or the white liquid on individuals of a second termite species, Labiotermes labralis. Of the 41 Labiotermes labralis that got the blue drop, 37 were immobilized. Of the 40 Labiotermes labralis that got the white drop, 9 were immobilized. Is the blue liquid toxic compared to the white liquid?The first step of the Durbin-Watson test for the presence of autocorrelation is to estimate the model and determine Select one: a. the residuals lagged one period. b. the current period residuals and the residuals lagged one period. c. the current period residuals. d. the current period residuals, the residuals lagged one period, and the residuals lagged two periods.The prelim grades (x) and midterm grades (y) of a sample of 10 MMW students is modeled by the regression line y = 12.0623 + 0.7771x. Estimate the prelim grade if the midterm grade is 83.
- In the article “Groundwater Electromagnetic Imaging in Complex Geological and Topographical Regions: A Case Study of a Tectonic Boundary in the French Alps” (S. Houtot, P. Tarits, et al., Geophysics, 2002:1048–1060), the pH was measured for several water samples in various locations near Gittaz Lake in the French Alps. The results for 11 locations on the northern side of the lake and for 6 locations on the southern side are as follows: Northern side: 8.1 8.2 8.1 8.2 8.2 7.4 7.3 7.4 8.1 8.1 7.9 Southern side: 7.8 8.2 7.9 7.9 8.1 8.1 Find a 98% confidence interval for the difference in pH between the northern and southern side.John investigated the quantitative determination of Cr in high-alloy steels by a potentiometric titration of Cr6+. Before titrating, the steel was dissolved in acid and the chromium oxidized to Cr6+ by peroxydisulfate. Following are the results (%w/w Cr) for the analysis of a single reference steel: 16.968, 16.922, 16.840, 16.883, 16.887, 16.977, 16.857, 16.728 Calculate the mean, standard deviation and the 95% confidence interval of the meanA deficiency of the trace element selenium in the diet can negatively impact growth, immunity, muscle and neuromuscular function, and fertility. The introduction of selenium supplements to dairy cows is justified when pastures have low selenium levels. Authors of the article “Effects of Short-Term Supplementation with Selenised Yeast on Milk Production and Composition of Lactating Cows” (Australian J. of Dairy Tech., 2004: 199–203) supplied the following data on milk selenium concentration (mg/L) for a sample of cows given a selenium supplement and a control sample given no supplement, both initially and after a 9-day period. Obs Init Se Init Cont Final Se Final Cont 1 11.4 9.1 138.3 9.3 2 9.6 8.7 104 8.8 3 10.1 9.7 96.4 8.8 4 8.5 10.8 89 10.1 5 10.3 10.9 88 9.6 6 10.6 10.6 103.8 8.6 7 11.8 10.1 147.3 10.4 8 9.8 12.3 97.1 12.4 9 10.9 8.8 172.6 9.3 10 10.3…
- Thirty Asian Utility vehicles were tested for biodiesel fuel efficiency (in km/liter). The following frequency distribution was obtained Calculate the exact kurtosis (population) and excess kurtosis of the population (+ interpretation), sample kurtosis for this grouped data.The table below presents the results of the test. 1) the researchers decide to use a 70-ms cutoff and obtain following tmredults: TP = 17, FP = 15, FN = 24, TN = 44. calculate the following values: a) sensitivity b) specificity c) PV (+) d) PV (-) 2) how did changing the cut-point affect the accuracy of the test?For a regression analysis, SST = 8291.0 and SSR = 7626.6. a. Obtain and interpret the coefficient of determination. b. Determine SSE.
- The spike stature of the plants grown from the seeds of the porcine separates (Dactylis glomerata L) collected from the University campus and İbradı Eynif pasture are given below. In this plant, compare whether there is a difference between regions in terms of spike height. Virgo Height (cm) Data obtained from plants collected from university campus 5 6 8 7 8 6 5 5 4 6 6 Data obtained from plants collected from Eynif pasture 12 9 11 9 9 11 9 10 11 10 Note: Your results interpretation according to two different possibilities (Do it separately, assuming that it is 0.07 and 0.04).The following partial JMP regression output for the Fresh detergent data relates to predicting demand for future sales periods in which the price difference will be .10. SE Fit = .165360573, s = .628152. Predicted Demand Lower 95% MeanDemand Upper 95% MeanDemand 31 8.181072245 7.842346262 8.519798229 StdErr IndivDemand Lower 95% IndivDemand Upper 95% MeanDemand 0.649552965 6.850522511 9.511621980 Click here for the Excel Data File (a) Report a point estimate of and a 95 percent confidence interval for the mean demand for Fresh in all sales periods when the price difference is .10. (Round your CI answers to 3 decimal places and other answer to 4 decimal places.) (b) Report a point prediction of and a 95 percent prediction interval for the actual demand for Fresh in an individual sales period when the price difference is .10. (Round your PI answers to 3 decimal places and other answer to 4 decimal places.) (c) StdErr Indiv Demand on…Samples are collected from the River X and pH values are observed. 9 different pH values are listed in table 3. Table 3 Concentrations 3.55 4.01 5.38 3.22 8.05 5.25 4.67 3.67 3.5Draw box plot and find a. Bowley’s coefficient of skewness b. Karl Pearson’s coefficient of skewness c. Third moment Rubric Stages of Process Marks Imagine and Plan 2Composition 2Effort 1


