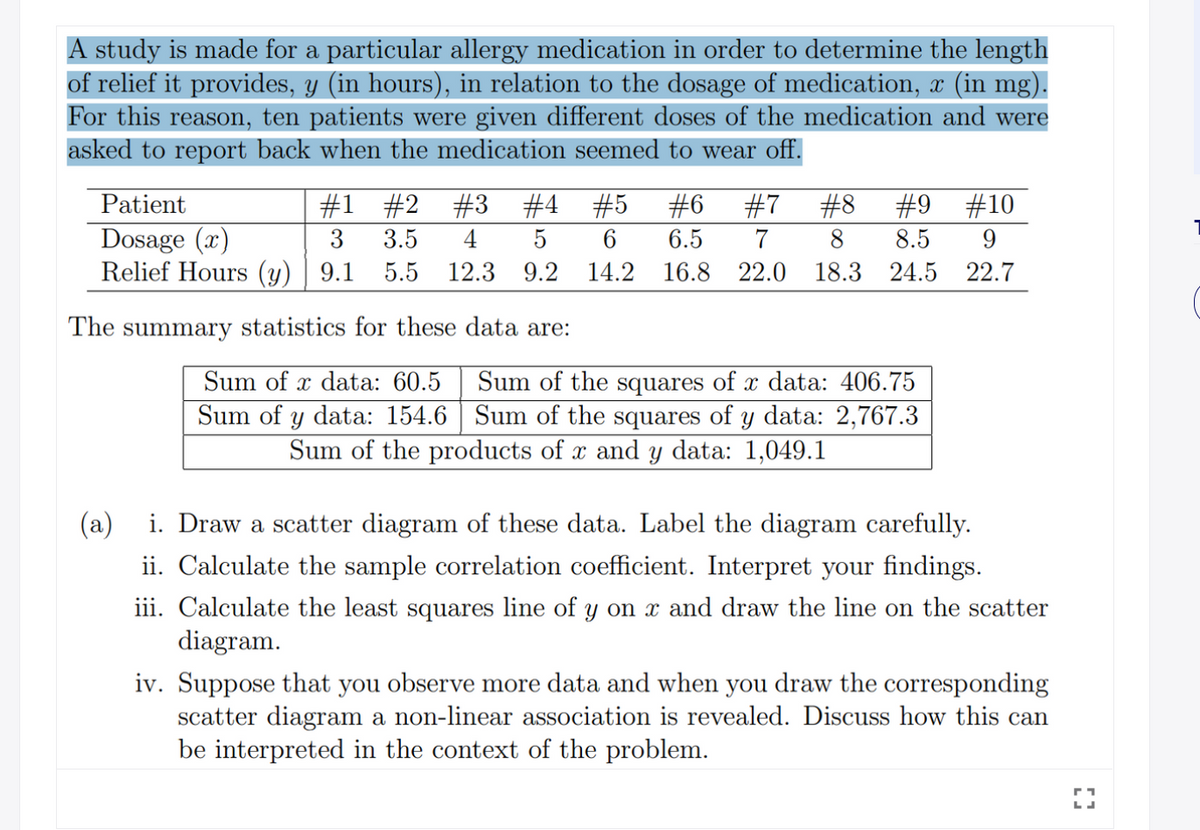
A study is made for a particular allergy medication in order to determine the length of relief it provides, y (in hours), in relation to the dosage of medication, x (in mg). For this reason, ten patients were given different doses of the medication and were asked to report back when the medication seemed to wear off. Patient #1 #2 #3 #4 #5 #6 #7 #8 #9 #10 Dosage (x) Relief Hours (y) | 9.1 3.5 4 6.5 7 8. 8.5 9 5.5 12.3 9.2 14.2 16.8 22.0 18.3 24.5 22.7 The summary statistics for these data are: Sum of the squares of x data: 406.75 Sum of y data: 154.6 | Sum of the squares of y data: 2,767.3 Sum of x data: 60.5 Sum of the products of x and data: 1,049.1 i. Draw a scatter diagram of these data. Label the diagram carefully. ii. Calculate the sample correlation coefficient. Interpret your findings. (a) iii. Calculate the least squares line of y on x and draw the line on the scatter diagram. iv. Suppose that you observe more data and when you draw the corresponding scatter diagram a non-linear association is revealed. Discuss how this can be interpreted in the context of the problem.


Family of Curves
A family of curves is a group of curves that are each described by a parametrization in which one or more variables are parameters. In general, the parameters have more complexity on the assembly of the curve than an ordinary linear transformation. These families appear commonly in the solution of differential equations. When a constant of integration is added, it is normally modified algebraically until it no longer replicates a plain linear transformation. The order of a differential equation depends on how many uncertain variables appear in the corresponding curve. The order of the differential equation acquired is two if two unknown variables exist in an equation belonging to this family.
XZ Plane
In order to understand XZ plane, it's helpful to understand two-dimensional and three-dimensional spaces. To plot a point on a plane, two numbers are needed, and these two numbers in the plane can be represented as an ordered pair (a,b) where a and b are real numbers and a is the horizontal coordinate and b is the vertical coordinate. This type of plane is called two-dimensional and it contains two perpendicular axes, the horizontal axis, and the vertical axis.
Euclidean Geometry
Geometry is the branch of mathematics that deals with flat surfaces like lines, angles, points, two-dimensional figures, etc. In Euclidean geometry, one studies the geometrical shapes that rely on different theorems and axioms. This (pure mathematics) geometry was introduced by the Greek mathematician Euclid, and that is why it is called Euclidean geometry. Euclid explained this in his book named 'elements'. Euclid's method in Euclidean geometry involves handling a small group of innately captivate axioms and incorporating many of these other propositions. The elements written by Euclid are the fundamentals for the study of geometry from a modern mathematical perspective. Elements comprise Euclidean theories, postulates, axioms, construction, and mathematical proofs of propositions.
Lines and Angles
In a two-dimensional plane, a line is simply a figure that joins two points. Usually, lines are used for presenting objects that are straight in shape and have minimal depth or width.
how to solve PART IV?

Step by step
Solved in 2 steps


