A researcher with the Department of Education followed a cohort of students who graduated from high school in a certain year, monitoring the progress the students made toward completing a bachelor's degree. One aspect of his research was to determine whether students who first attended community college took longer to attain a bachelor's degree than those who immediately attended and remained at a 4-year institution. The data in the table attached below summarize the results of his study. Complete parts a) through e) below. Click here to view the sample data. Click here to view Student's t-distribution table. O A. Ho: Hcommunity college >Hno transfer: H1: Hcommunity college Hno transfer O C. Ho: Hcommunity college =Pno transfer: H1:Hcommunity college Hno transfer Determine the test statistic. t= 12,95 (Round to two decimal places as needed.) Determine the critical value(s). Select the correct choice below and fill in the answer box(es) within your choice. (Round to three decimal places as needed.) O A. The critical value is O B. The lower critical value is The upper critical value is
A researcher with the Department of Education followed a cohort of students who graduated from high school in a certain year, monitoring the progress the students made toward completing a bachelor's degree. One aspect of his research was to determine whether students who first attended community college took longer to attain a bachelor's degree than those who immediately attended and remained at a 4-year institution. The data in the table attached below summarize the results of his study. Complete parts a) through e) below. Click here to view the sample data. Click here to view Student's t-distribution table. O A. Ho: Hcommunity college >Hno transfer: H1: Hcommunity college Hno transfer O C. Ho: Hcommunity college =Pno transfer: H1:Hcommunity college Hno transfer Determine the test statistic. t= 12,95 (Round to two decimal places as needed.) Determine the critical value(s). Select the correct choice below and fill in the answer box(es) within your choice. (Round to three decimal places as needed.) O A. The critical value is O B. The lower critical value is The upper critical value is

Algebra: Structure And Method, Book 1
(REV)00th Edition
ISBN:9780395977224
Author:Richard G. Brown, Mary P. Dolciani, Robert H. Sorgenfrey, William L. Cole
Publisher:Richard G. Brown, Mary P. Dolciani, Robert H. Sorgenfrey, William L. Cole
Chapter4: Polynomials
Section4.8: Rate-time-distance Problems
Problem 18P

Related questions

Topic Video
Question
just the last part, i included the sample. thank you!
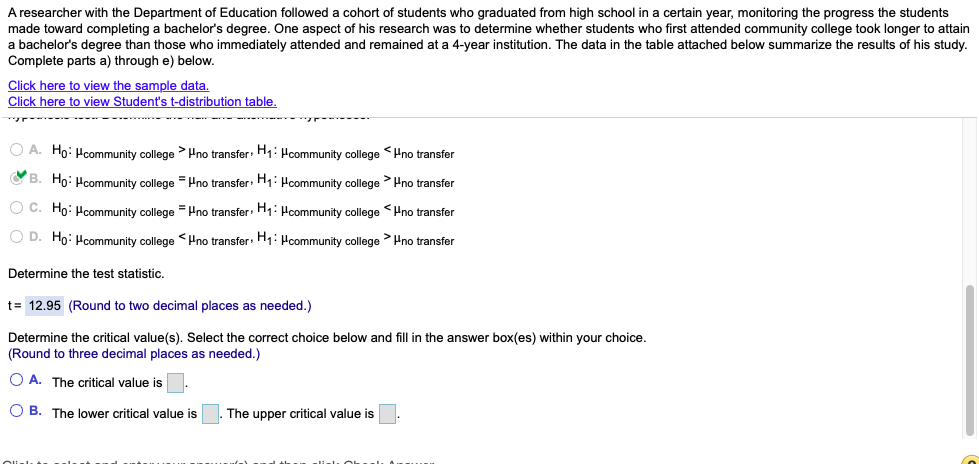
Transcribed Image Text:A researcher with the Department of Education followed a cohort of students who graduated from high school in a certain year, monitoring the progress the students
made toward completing a bachelor's degree. One aspect of his research was to determine whether students who first attended community college took longer to attain
a bachelor's degree than those who immediately attended and remained at a 4-year institution. The data in the table attached below summarize the results of his study.
Complete parts a) through e) below.
Click here to view the sample data.
Click here to view Student's t-distribution table.
O A. Ho: Hcommunity college > Hno transfer: H1: Hcommunity college Hno transfer
O B. Ho: Hcommunity college = Pno transfer: H: Pcommunity college Hno transfer
O C. Ho: Hcommunity college = Pno transfer: H;: Hcommunity college <Hno transfer
O D. Ho: Hcommunity college <Hno transfer: H1:Hcommunity college > Hno transfer
Determine the test statistic.
t= 12.95 (Round to two decimal places as needed.)
Determine the critical value(s). Select the correct choice below and fill in the answer box(es) within your choice.
(Round to three decimal places as needed.)
O A. The critical value is
O B. The lower critical value is
The upper critical value is
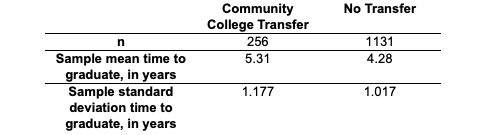
Transcribed Image Text:Community
College Transfer
No Transfer
256
1131
Sample mean time to
graduate, in years
Sample standard
5.31
4.28
1.177
1.017
deviation time to
graduate, in years
Expert Solution
This question has been solved!
Explore an expertly crafted, step-by-step solution for a thorough understanding of key concepts.

This is a popular solution!

Trending now
This is a popular solution!

Step by step
Solved in 2 steps

Knowledge Booster


Learn more about
Need a deep-dive on the concept behind this application? Look no further. Learn more about this topic, statistics and related others by exploring similar questions and additional content below.Recommended textbooks for you
Algebra: Structure And Method, Book 1
Algebra
ISBN:
9780395977224
Author:
Richard G. Brown, Mary P. Dolciani, Robert H. Sorgenfrey, William L. Cole
Publisher:
McDougal Littell

Big Ideas Math A Bridge To Success Algebra 1: Stu…
Algebra
ISBN:
9781680331141
Author:
HOUGHTON MIFFLIN HARCOURT
Publisher:
Houghton Mifflin Harcourt
Algebra: Structure And Method, Book 1
Algebra
ISBN:
9780395977224
Author:
Richard G. Brown, Mary P. Dolciani, Robert H. Sorgenfrey, William L. Cole
Publisher:
McDougal Littell
Big Ideas Math A Bridge To Success Algebra 1: Stu…
Algebra
ISBN:
9781680331141
Author:
HOUGHTON MIFFLIN HARCOURT
Publisher:
Houghton Mifflin Harcourt