A researcher would like to know if IQ scores are related to age. Using 35 freshmen students, he found out that the computed r = 0.58. At 0.10 level of significance, can he conclude that the relationship exists in the population? ANSWER Ho: На: Computed Value: Tabular value: Decision: Summary:
A researcher would like to know if IQ scores are related to age. Using 35 freshmen students, he found out that the computed r = 0.58. At 0.10 level of significance, can he conclude that the relationship exists in the population? ANSWER Ho: На: Computed Value: Tabular value: Decision: Summary:

Glencoe Algebra 1, Student Edition, 9780079039897, 0079039898, 2018
18th Edition
ISBN:9780079039897
Author:Carter
Publisher:Carter
Chapter10: Statistics
Section10.3: Measures Of Spread
Problem 1GP

Related questions
Question
Calculate the following questions and use the table for reference.Show the complete solution.
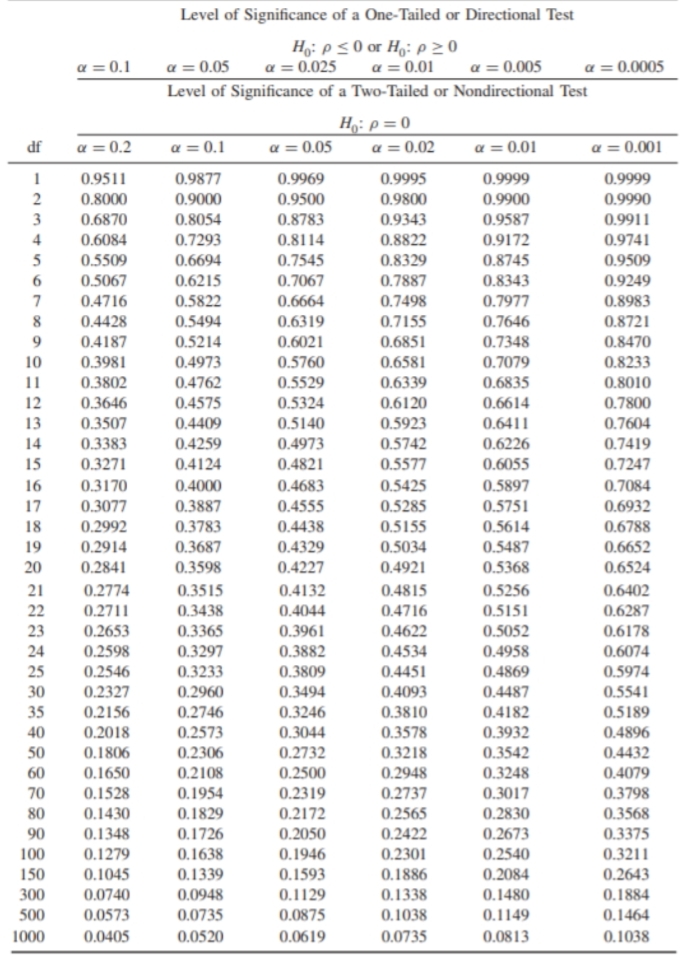
Transcribed Image Text:Level of Significance of a One-Tailed or Directional Test
Ho: p 5 0 or H: p 20
a = 0.025
a = 0.1
a = 0.05
a = 0.01
a = 0.005
a = 0.0005
Level of Significance of a Two-Tailed or Nondirectional Test
Ho: p = 0
a = 0.02
df
a = 0.2
a = 0.1
a = 0.05
a = 0.01
a = 0.001
0.9511
0.9877
0.9969
0.9995
0.9999
0.9999
0.8000
0.9000
0.9500
0.9800
0.9900
0.9990
3
0.6870
0.8054
0.8783
0.9343
0.9587
0.9911
4
0.6084
0.7293
0.8114
0.8822
0.9172
0.9741
5
0.5509
0.6694
0.7545
0.8329
0.8745
0.9509
0.5067
0.6215
0.7067
0.7887
0.8343
0.9249
0.4716
0.5822
0.6664
0.7977
0.8983
0.8721
0.7498
8
0.4428
0.5494
0.6319
0.7155
0.7646
0.4187
0.5214
0.6021
0.6851
0.7348
0.8470
10
0.3981
0.4973
0.5760
0.6581
0.7079
0.8233
11
0.3802
0.4762
0.5529
0.6339
0.6835
0.8010
12
0.3646
0.4575
0.5324
0.6120
0.6614
0.7800
0.5140
0.4973
13
0.3507
0.4409
0.5923
0.6411
0.7604
14
0.3383
0.4259
0.5742
0.6226
0.7419
15
0.3271
0.4124
0.4821
0.5577
0.6055
0.7247
16
0.3170
0.4000
0.4683
0.5425
0.5897
0.7084
17
0.3077
0.3887
0.4555
0.5285
0.5751
0.6932
0.5614
0.5487
18
0.2992
0.3783
0.4438
0.5155
0.6788
19
0.2914
0.3687
0.4329
0.5034
0.6652
20
0.2841
0.3598
0.4227
0.4921
0.5368
0.6524
21
0.2774
0.3515
0.4132
0.4815
0.5256
0.6402
22
0.2711
0.3438
0.4044
0.4716
0.5151
0.6287
0.3365
0.3297
0.6178
0.6074
23
0.2653
0.3961
0.4622
0.5052
0.3882
0.3809
24
0.2598
0.4534
0.4958
25
0.2546
0.3233
0.4451
0.4869
0.5974
30
0.2327
0.2960
0.3494
0.4093
0.4487
0.5541
35
0.2156
0.2746
0.3246
0.3810
0.4182
0.5189
40
0.2018
0.2573
0.3044
0.3578
0.3932
0.4896
50
0.1806
0.2306
0.2732
0.3218
0.3542
0.4432
60
0.1650
0.2108
0.2500
0.2948
0.3248
0.4079
0.2737
0.2565
70
0.1528
0.1954
0.2319
0.3017
0.3798
80
0.1430
0.1829
0.2172
0.2830
0.3568
90
0.1348
0.1726
0.2050
0.2422
0.2673
0.3375
100
0.1279
0.1638
0.1946
0.2301
0.2540
0.3211
150
0.1045
0.1339
0.1593
0.1886
0.2084
0.2643
300
0.0740
0.0948
0.1129
0.1338
0.1480
0.1884
500
0.0573
0.0735
0.0875
0.1038
0.1149
0.1464
1000
0.0405
0.0520
0.0619
0.0735
0.0813
0.1038
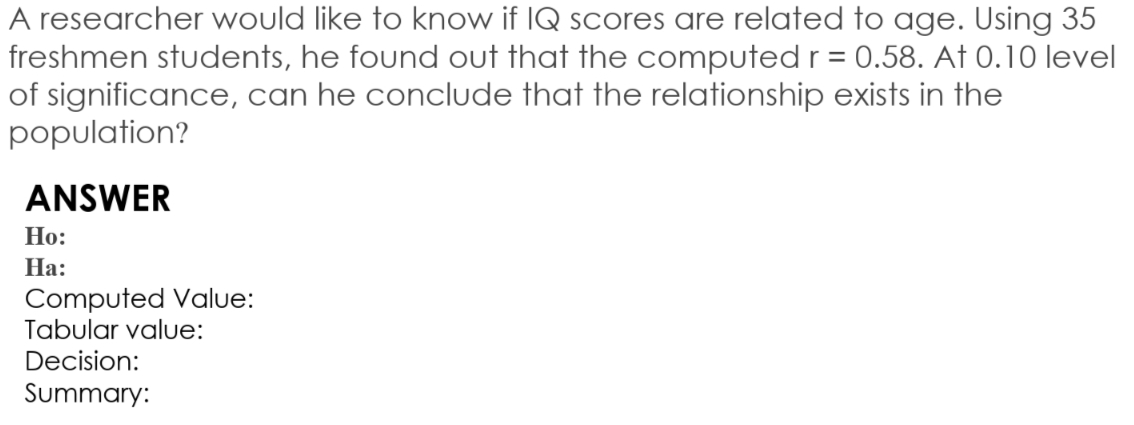
Transcribed Image Text:A researcher would like to know if IQ scores are related to age. Using 35
freshmen students, he found out that the computed r = 0.58. At 0.10 level
of significance, can he conclude that the relationship exists in the
population?
ANSWER
Но:
На:
Computed Value:
Tabular value:
Decision:
Summary:
Expert Solution
This question has been solved!
Explore an expertly crafted, step-by-step solution for a thorough understanding of key concepts.

Step by step
Solved in 4 steps

Recommended textbooks for you
Glencoe Algebra 1, Student Edition, 9780079039897…
Algebra
ISBN:
9780079039897
Author:
Carter
Publisher:
McGraw Hill

Holt Mcdougal Larson Pre-algebra: Student Edition…
Algebra
ISBN:
9780547587776
Author:
HOLT MCDOUGAL
Publisher:
HOLT MCDOUGAL
Glencoe Algebra 1, Student Edition, 9780079039897…
Algebra
ISBN:
9780079039897
Author:
Carter
Publisher:
McGraw Hill
Holt Mcdougal Larson Pre-algebra: Student Edition…
Algebra
ISBN:
9780547587776
Author:
HOLT MCDOUGAL
Publisher:
HOLT MCDOUGAL