A researcher would like to know if IQ scores are related to age. Using 35 freshmen students, he found out that the computed r = 0.58. At 0.10 level of significance, can he conclude that the relationship exists in the population? ANSWER Но: На: Computed Value: Tabular value: Decision: Summary:
A researcher would like to know if IQ scores are related to age. Using 35 freshmen students, he found out that the computed r = 0.58. At 0.10 level of significance, can he conclude that the relationship exists in the population? ANSWER Но: На: Computed Value: Tabular value: Decision: Summary:

Glencoe Algebra 1, Student Edition, 9780079039897, 0079039898, 2018
18th Edition
ISBN:9780079039897
Author:Carter
Publisher:Carter
Chapter10: Statistics
Section10.3: Measures Of Spread
Problem 1GP

Related questions
Question
Calculate the following questions and use the table for reference.Show the complete solution.
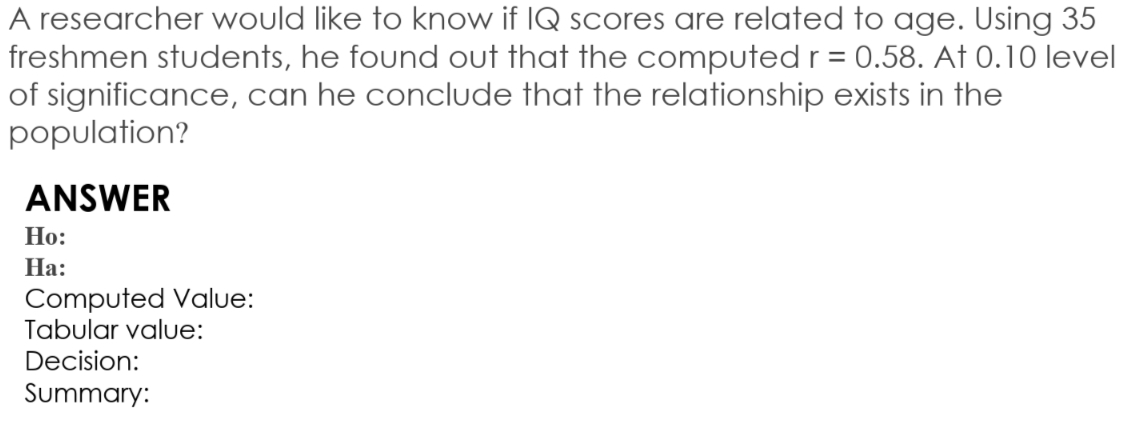
Transcribed Image Text:A researcher would like to know if IQ scores are related to age. Using 35
freshmen students, he found out that the computed r = 0.58. At 0.10 level
of significance, can he conclude that the relationship exists in the
population?
ANSWER
Но:
На:
Computed Value:
Tabular value:
Decision:
Summary:
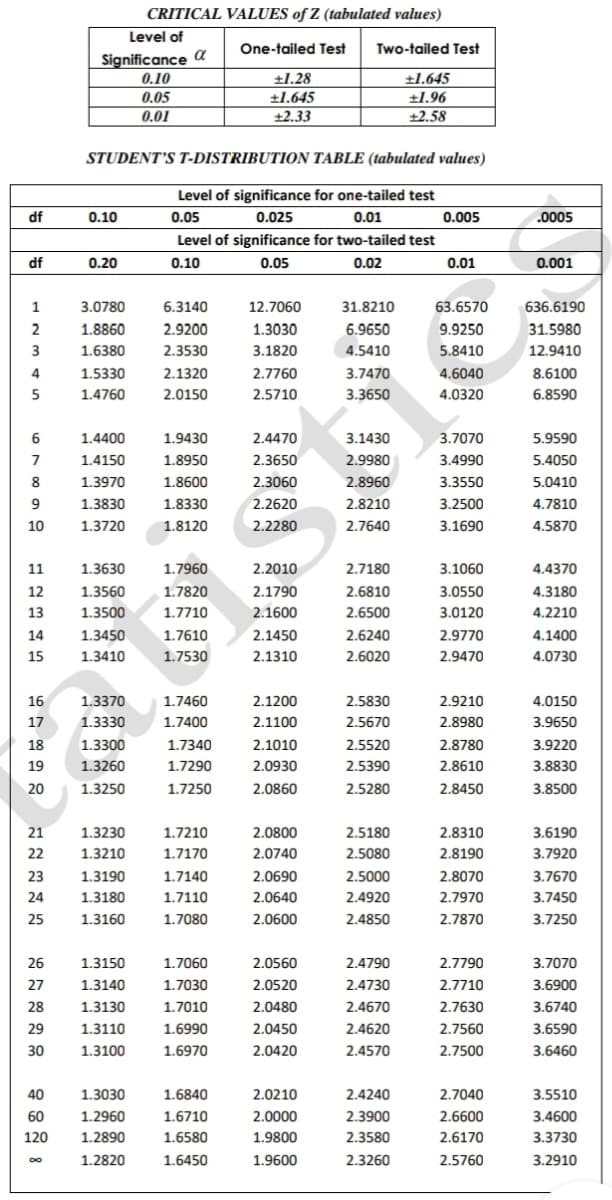
Transcribed Image Text:CRITICAL VALUES of Z (tabulated values)
Level of
One-tailed Test
Two-tailed Test
Significance a
0.10
±1.28
±1.645
+1.96
0.05
+1.645
0.01
+2.33
+2.58
STUDENT'S T-DISTRIBUTION TABLE (tabulated values)
Level of significance for one-tailed test
df
0.10
0.05
0.025
0.01
0.005
.0005
Level of significance for two-tailed test
df
0.20
0.10
0.05
0.02
0.01
0.001
1
3.0780
6.3140
12.7060
31.8210
63.6570
636.6190
2
1.8860
2.9200
1.3030
6.9650
9.9250
31.5980
3
1.6380
2.3530
3.1820
4.5410
5.8410
12.9410
4
1.5330
2.1320
2.7760
3.7470
4.6040
8.6100
1.4760
2.0150
2.5710
3.3650
4.0320
6.8590
6
1.4400
1.9430
2.4470
3.1430
3.7070
5.9590
7
1.4150
1.8950
2.3650
2.9980
3.4990
5.4050
8
1.3970
1.8600
2.3060
2.8960
3.3550
5.0410
9
1.3830
1.8330
2.2620
2.8210
3.2500
4.7810
10
1.3720
1.8120
2.2280
2.7640
3.1690
4.5870
11
1.3630
1.7960
2.2010
2.7180
3.1060
4.4370
12
1.3560
1.7820
2.1790
2.6810
3.0550
4.3180
13
1.3500
1.7710
2.1600
2.6500
3.0120
4.2210
14
1.3450
1.7610
2.1450
2.6240
2.9770
4.1400
15
1.3410
1.7530
2.1310
2.6020
2.9470
4.0730
16
1.3370
1.7460
2.1200
2.5830
2.9210
4.0150
17
1.3330
1.7400
2.1100
2.5670
2.8980
3.9650
18
1.3300
1.7340
2.1010
2.5520
2.8780
3.9220
19
1.3260
1.7290
2.0930
2.5390
2.8610
3.8830
20
1.3250
1.7250
2.0860
2.5280
2.8450
3.8500
21
1.3230
1.7210
2.0800
2.5180
2.8310
3.6190
22
1.3210
1.7170
2.0740
2.5080
2.8190
3.7920
23
1.3190
1.7140
2.0690
2.5000
2.8070
3.7670
24
1.3180
1.7110
2.0640
2.4920
2.7970
3.7450
25
1.3160
1.7080
2.0600
2.4850
2.7870
3.7250
26
1.3150
1.7060
2.0560
2.4790
2.7790
3.7070
27
1.3140
1.7030
2.0520
2.4730
2.7710
3.6900
28
1.3130
1.7010
2.0480
2.4670
2.7630
3.6740
29
1.3110
1.6990
2.0450
2.4620
2.7560
3.6590
30
1.3100
1.6970
2.0420
2.4570
2.7500
3.6460
40
1.3030
1.6840
2.0210
2.4240
2.7040
3.5510
60
1.2960
1.6710
2.0000
2.3900
2.6600
3.4600
120
1.2890
1.6580
1.9800
2.3580
2.6170
3.3730
1.2820
1.6450
1.9600
2.3260
2.5760
3.2910
Expert Solution
This question has been solved!
Explore an expertly crafted, step-by-step solution for a thorough understanding of key concepts.

Step by step
Solved in 2 steps with 2 images

Recommended textbooks for you
Glencoe Algebra 1, Student Edition, 9780079039897…
Algebra
ISBN:
9780079039897
Author:
Carter
Publisher:
McGraw Hill

Holt Mcdougal Larson Pre-algebra: Student Edition…
Algebra
ISBN:
9780547587776
Author:
HOLT MCDOUGAL
Publisher:
HOLT MCDOUGAL
Glencoe Algebra 1, Student Edition, 9780079039897…
Algebra
ISBN:
9780079039897
Author:
Carter
Publisher:
McGraw Hill
Holt Mcdougal Larson Pre-algebra: Student Edition…
Algebra
ISBN:
9780547587776
Author:
HOLT MCDOUGAL
Publisher:
HOLT MCDOUGAL