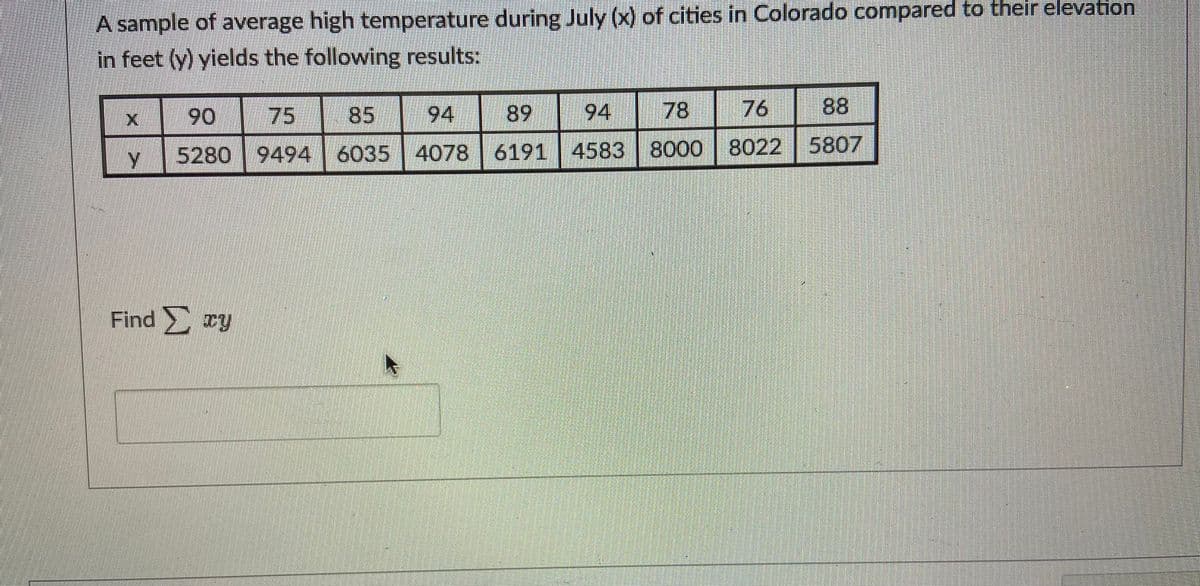
A sample of average high temperature during July (x) of cities in Colorado compare in feet (y) yields the following results: 90 75 85 94 89 94 78 76 88 5280 9494 6035 4078 6191 4583 8000 8022 5807 Find υy


Q: The following results are from a dataset that measured the times to morbidity (in seconds) for three…
A: The result from a dataset that measured the times to morbidity (in second) for three genetic strains…
Q: A local group claims that the police issue more than 60 speeding tickets a day in their area. To…
A: H0:μ = 60 (Null)H1: μ > 60 (Alternative) ===================================== x¯ =…
Q: The following data are measurements of temperature (x = °F) and chirping frequency (y = chirps per…
A: In the given information the data of measurement of temperature and chirping frequency for the…
Q: In a tasting session, a random sample of 100 subjects from a consumer population tasted a certain…
A: Given information: n=100μ=6.0 One-sided p value of the test is 0.0068.
Q: Engineers at the Maxwell Products Company have designed a new metal bearing rod that is alleged to…
A: For the given sample values, x¯=25266, from the excel function, =AVERAGE(O1:O9)s=186.0081, from the…
Q: The table below shows the results from the specific gravity (S.G.) test performed in a soil…
A: specific gravity samples cumulative sample 2.30-2.39 1 1 2.40-2.49 2 3…
Q: xample: From the following data, find the following: 1- Find the equation with the explanation 2-…
A: In the given case we are provided with three columns of data from which it can be assumed that the…
Q: Suppose that the mean systolic blood pressure for women over age seventy is 132 mmHg (millimeters of…
A:
Q: . X7. (a) Calculate mean deviation from the following series : 11 10 12 13 14 12 18 12 c.t.
A:
Q: Suppose you computed r=−0.285 using n=13 data points that were collected when studying the…
A: Given information n = 13 r=−0.285 df = n - 2 = 13 - 2 = 11 Given values df12345678910CV (+ and…
Q: Calculate the thrid quartile Q3 for the following data: 1 367889 2 34455567 3 0246 4 3479 5 12 O 18…
A: From the given data13,16,17,18,18,19,23,24,24,25,25,25,26,27,30,32,34,36,43,44,47,49,51,52here the…
Q: Are the following results significant at α=.01? F(2,27) =10.56, p=.02 Yes No 2. A large F-ratio…
A: 1. The F statistic and corresponding p value are F(2,27) =10.56, p =.02 respectively.
Q: Here is a bivariate data set.xy182425915011737106295223812246 Find the correlation coefficient and…
A: Step-by-step procedure to find the correlation using Excel Megastat:Enter the bivariate data into…
Q: 18, For females, find the first quartile Qı, which is the length separating the bottom 25% from the…
A:
Q: Given a standard normally distributed data with area left of z is 0.4050. Find the z-score.
A: Given that. X~N( 0 , 1 ) μ=0 , ?=1 (for standard normal distribution) Z-score =( x - μ )/?
Q: For the given below data, determine ß1 and ß2 and also measure the kurtosis and identify which…
A: Kurtosis tells us whether the distribution, when plotted on a graph would give us a normal curve…
Q: The average weight of a Coastal male Grizzly Bear is approximately normal with E(x); =795 pounds and…
A:
Q: Based on the Minitab output below from a Gauge R&R, what is the ATAG signal to noise ratio? Gage…
A: For the given data AIAG SIGNAL TO NOISE RATIO = 85.67%
Q: Based on the scatterplot and computer output, a reasonable estimate of mean temperature in Kelvin…
A: From the output, the regression equation is
Q: John investigated the quantitative determination of Cr in high-alloy steels by a potentiometric…
A: The results for the analysis of a single reference steel is given. Let xi denote the sample…
Q: For a data analysis what is the conclusion supported by the ANOVA Table. ANOVA Source…
A: H0: μ1=μ2=μ3=μ4 H1: Not all mean are equal
Q: Data on pull-off force (pounds) for connectors used in an automobile engine application are as…
A: d) Point estimate of the population standard deviation: The point estimate of the population…
Q: The data to the right represent the number of chocolate chips per cookie in a random sample of a…
A: Median: The median is the middle-most observation in an ordered (in an ascending or descending…
Q: 376 an38. From the following data calculate Karl Pearson's coefficient of skewness: 80 Maks more…
A:
Q: D. Let us examine Mendel's F2 data for the round/wrinkled and yellow/green dihybrid cross. He…
A:
Q: e in each Big Chip cookie elects a sample of 101 co umber of chocolate chips as a mean of 13 2 and a…
A: Given, sample size (n) = 101 sample mean (x̄) = 13.2 sample standard deviation (s) = 1.3…
Q: Consider the following Al ible. Source S d.f. MS V.R. 2.824 115.7527 14.0714 Treatments 231.5054…
A: a) From the given output, The design was two way ANOVA, since the source of variation is given by…
Q: The director of an alumni association wants to determine whether there is any type of relationship…
A:
Q: A sample of 10 students from a Statistics 100 class had the following grades on a final exam: 56 89…
A: We have given data 56 89 65 78 82 58 90 75 80 86 X=70 Z-score = (x - mu)/sigma
Q: Can a low baromater reading be used to predict manimum wind speed of an approaching tropical…
A: From the provided information, a) The scatter plot of the data can be constructed using excel steps…
Q: A research poll showed that 1222 out of 1969 randomly polled people in a country favor the death…
A: a) From the given information, the sentence will be filled by following entries:0.599 and 0.642…
Q: A study was performed to investigate the shear strength of soil (y) as it related to depth in feet…
A:
Q: a. At the 5% sigr than those wh- b. Are the sample c. If independent dent, explain w 1r
A:
Q: Let X ~ U (a, b). Derive X mean and variance. Use the method of moments to construct an estimator…
A: Given, X~U(a,b) Then pdf is
Q: A farm packs rejected fruits into bags. A screening was conducted and the results of 1000 bags…
A: Here, Interval Frequency, f Midpoint, x fx (x-x)2 f.(x-x)2 56-59 5 57.5 287.5 108.3056 541.5282…
Q: A study was made on the amount of converted sugar in a certain process at various temperatures. The…
A: Sum of product difference between the x and y. It is calculated by sum of product difference between…
Q: Qnó. In order to investigate material more accurately from dichotic listening task was ca positively…
A: Let us denote µ1 as the mean number of words recalled from the left ear and µ2 as the mean number of…
Q: The following data are the viscosity measurements for a chemical product observed hourly (read down,…
A:
Q: The following data represent the concentration of dissolved organic carbon (mg/L) collected from 20…
A: Solution: n = 20 Given data :
Q: Stephen Stigler determined in 1977 that the speed of light is 299,710.5 km/sec. Some measurements of…
A: Given: Mean, μ=299710.5 Level of significance=1% α=0.01 (i) Set the hypothesis: H0: μ=299710.5Ha:…
Q: From the values of the factors given below, find the corrected values of the first four Moments…
A:
Q: A sample of 100 dry battery cells tested to find the length of life produced the tollowing results :…
A:
Q: The director of an alumni association wants to determine whether there is any type of relationship…
A: Given n=6α=0.05
Q: The measurements of suspended solid material concentration in water samples is illustrated in the…
A: A box plot is a graphical method for depicting groups of numerical data through their quartiles. It…
Q: Scores on an accounting exam ranged from 42 to 92, with quartiles Q1= 59.00, Q2= 79.0, and Q3=82.25.…
A: (a) Procedure for constructing boxplot: The x-axis represents the units of data values ranging from…
Q: State the t critical value that would be used for a 99% interval based on a sample size of 37.
A: Given information- Sample size, n = 37 Confidence level, c = 99% So, significance level (α) = 0.01…
Q: Calculate x, which gives f(x) = 2 in the dataset, using Newton's Divided Differences Method with…
A: The given data set is, x 2 3 4 f0 f1 f2 f(x) 0.99 3.88 7.66
Q: Calculate the coefficient of variation between X and Y from the following data:
A:
Q: dy Pine trees were sampled from each of two blocks of pines, 100 km apart and in different rainfall…
A: Given, n1=10n2=10x1=12.4x2=16.8s12=4.8s22=5.1α=1-0.95=0.05 The degrees of freedom is obtained as-…
Q: Ina certain type of metal test specimen, the normal stress on a specimen is known to be functionally…
A: The independent variable is Normal Stress. The dependent variable is Shear Resistance. We have to…


Trending now
This is a popular solution!

Step by step
Solved in 2 steps with 2 images


- Find the average rates of change of f(x)=x2+2x (a) from x1=3 to x2=2 and (b) from x1=2 to x2=0.A sample of average high temperature during July (x) of cities in Colorado compared to their elevation in feet (y) yields the following results: x 90 75 85 94 89 94 78 76 88 y 5280 9494 6035 4078 6191 4583 8000 8022 5807 Find y2Suppose you computed r=−0.285 using n=13 data points that were collected when studying the relationship between average weekly overtime and years working for a company. Using the critical values table below, determine if the value of r is significant or not. df12345678910CV (+ and -)0.9970.9500.8780.8110.7540.7070.6660.6320.6020.576df11121314151617181920CV (+ and -)0.5550.5320.5140.4970.4820.4680.4560.4440.4330.423df21222324252627282930CV (+ and -)0.4130.4040.3960.3880.3810.3740.3670.3610.3550.349df405060708090100CV (+ and -)0.3040.2730.2500.2320.2170.2050.195 Select the correct answer below: r is significant because it is between the positive and negative critical values. r is not significant because it is between the positive and negative critical values. r is significant because it is not between the positive and negative critical values. r is not significant because it is not between the positive and negative critical values.
- A z-score of –1.6 has a corresponding Stanine score of:Here is a bivariate data set.xy182425915011737106295223812246 Find the correlation coefficient and report it accurate to four decimal places. r =The diameter of a metal shaft used in a disk-drive unit is normally distributed with mean 0.2508 in. and std. dev. 0.0005 in. The specification on the shaft have been established as (0.25-0.0015 in, 0.25+0.0015in) If the process mean has been adjusted to 0.25 in, what fraction of the shafts produced does NOT conform to specifications? a). 0.0027 b). 0.0013 c).0.08 d). 0.16
- A researcher collects data that represents the average number of hours of sleep in the last two nights by 8 depressed patients and 9 non-depressed patients. The researcher is interested in whether the two groups reliably differ in the amount of sleep they get. Use Jamovi to calculate t-obt and the p value.Researchers interested in lead exposure due to car exhaust sampled the blood of 52 police officers subjected to constant inhalation of automobile exhaust fumes while working traffic enforcement in a primarily urban environment. The blood samples of these officers had an average lead concentration of 124.32 µg/l and a SD of 37.74 µg/l; a previous study of individuals from a nearby suburb, with no history of exposure, found an average blood level concentration of 35 µg/l. Based on your preceding result, without performing a calculation, would a 99% confidence interval for the average blood concentration level of police officers contain 35 µg/l? Based on your preceding result, without performing a calculation, would a 99% confidence interval for this difference contain 0? Explain why or why not.A survey among the workers in a large manufacturing company was taken, in order to findout from which company the workers had purchased their mobile phones, and to find outwhether the choice of mobile phone company was related to the type of worker. The resultsare shown in the table below. ls there evidence, at 5% level, that the choice of Phone Company is independent of the type ofworker?
- The following data pertain to x, the amount of fertil-izer (in pounds) that a farmer applies to his soil, and y, his yield of wheat (in bushels per acre): xy xy xy112 33 88 24 37 2792 28 44 17 23 972 38 132 36 77 3266 17 23 14 142 38112 35 57 25 37 1388 31 111 40 127 2342 8 69 29 88 31126 37 19 12 48 3772 32 103 27 61 2552 20 141 40 71 1428 17 77 26 113 26 Assuming that the data can be looked upon as a randomsample from a bivariate normal population, calculate rand test its significance at the 0.01 level of significance.Also, draw a scattergram of these paired data and judgewhether the assumption seems reasonable.A survey of 90 recently delivered women on the rolls of a county welfare department revealed that 27 had a history of intrapartum or postpartum infection. What is the critical value of z if we need to conclude that the population proportion with a history of intrapartum or postpartum infection is less than 0.25.Q1 A) List down the measures of central tendency and measures of dispersion 2) The operations manager of a plant that manufactures tires wants to compare the actual inner diameters of two grades of tires, each of B) which is expected to be 575 millimeters. A sample of five tires of each grade was selected, and the results representing the inner diameters of the tires, ranked from smallest to largest, are as follows. Grade X grade Y 568 570 575 578 584 573 574 575 577 578 requirement. a) for each of the tow grades of tries, compute the mwan, median, and standred deviation. b) which grade of tire providing better quality? explain. c) what would be the effect on your answer in (a) and (b) if the last value for grade Y were 588 insert 578 explain. C) The file contins the overall miles per gallon (MPG) OF 2010 family sedan: 24 21 22 23 24 34 34 34 20 20 22 22 44 32 20 20 22 20 39 20 Source:…
