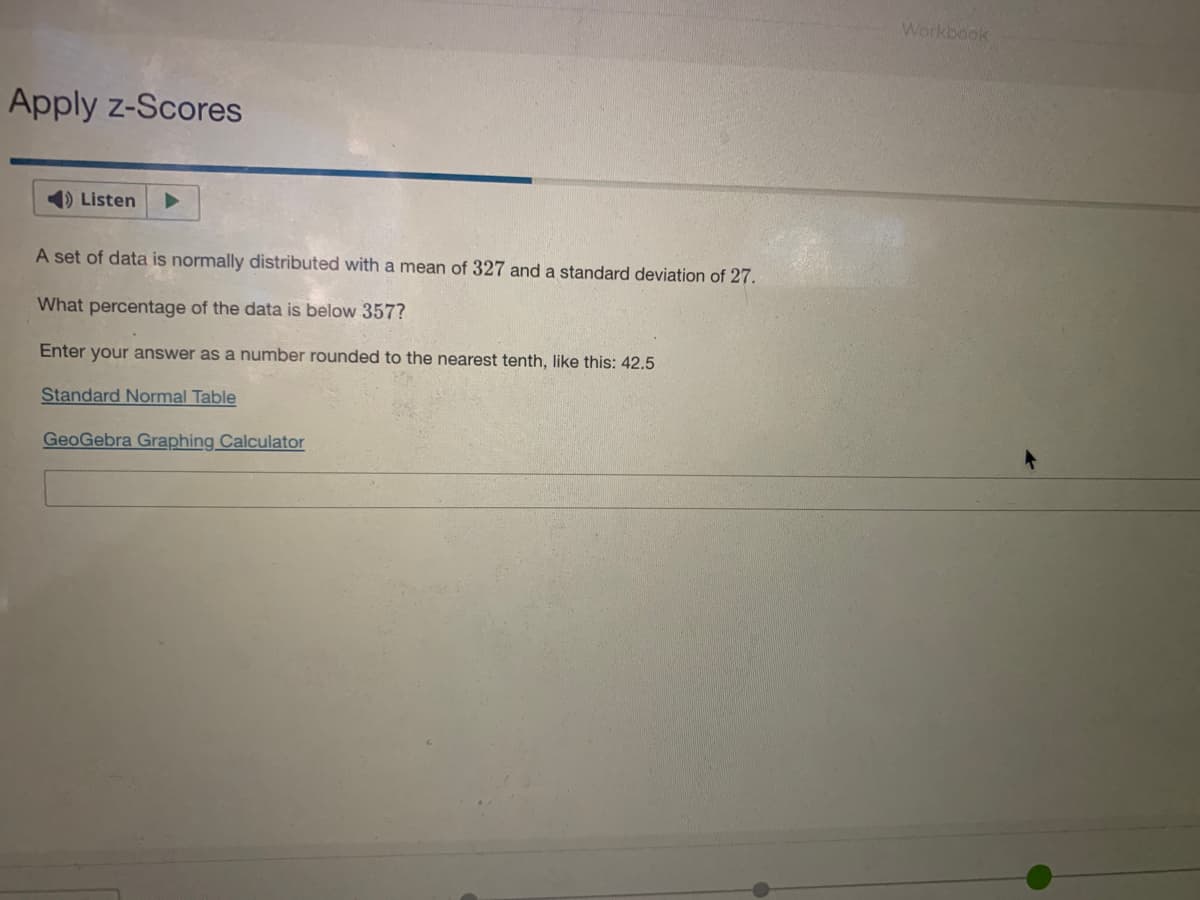
A set of data is normally distributed with a mean of 327 and a standard deviation of 27. What percentage of the data is below 357? Enter your answer as a number rounded to the nearest tenth, like this: 42.5
Q: 10. Let (1, 12, ., In) denote a random sample from the exponential distribution with parameter A.…
A: Given x1, x2, . . ., xn be random sample from the exponential distribution with parameter λ.
Q: Suppose that the number of Facebook friends users have is normally distributed with a mean of 132…
A: Let X be the random variable from Normal distribution with mean (µ) = 128, standard deviation (σ) =…
Q: Std. Deviation 16.760 19.474 Std. Error Neighbourhood Trips A Mean N 7 22.29 7 43.29 Mean 6.335 B…
A: Solution: In the given example we are interested in testing the hypothesis that the variance of the…
Q: Suppose that the duration of a particular type of criminal trial is known to be normally distributed…
A: Let X be the number of days from Normal distribution with mean (µ) = 22 and standard deviation (σ) =…
Q: GIven the following ANOVA table: Source DF MS Regression 1,800.0 900.0 1 1,800.00 20.00 Error 10…
A: Anova table is given in the question.
Q: The following data represent the number of days absent per year in a population of six employees of…
A: We have given data are 1,3,5,6,7,10 Mean for the given data is µ = ∑x/n = (1+3+5+6+7+10)/6 = 5.33
Q: How many classes should there be if the class width is 4? 1 2 3 4 6.
A: The no.of observations is, N =20 The formula for finding the no.of classes is,
Q: (d) Use the combined data of 80 students, construct a 95% confidence interval estimate of the…
A: Given that Total students=n=40+40=80 Number of pass students=X=28+32=60
Q: Square the Estimate .890 ,793 ,777 1.17580 ANOVA Sum of df Mean F Sig. Squares Square sion 206.153 3…
A: Hi! Thank you for the question As per the honour code, We’ll answer the first question since the…
Q: find the 95% confidence interval to estimate the proportion of CCC g.Are we confident that the…
A: here given, Suppose that we survey a random sample of 100 adults living in Contra Costa County and…
Q: P-value = 0.102 (Round to three decimal places as needed.) d. What is the null hypothesis, and what…
A: In a newspaper's survey of 486 people, 53.7% said that we should replace passwords with biometric…
Q: The Ministry of Health is interested in determining whether the average nicotine content of regular,…
A: Null Hypothesis: H0: The means for the three cigarettes are equal. Alternative Hypothesis: H1: The…
Q: answers to four decimal places.) (a) Between 63 inches and 67 inches. P = (b) Between 61 inches…
A: As per bartleby guidelines we can solve only first three subparts and rest can be reposted
Q: A simple random sample of six values had mean x = 13.00 and standard deviations = 7.155. Calculate…
A: From the provided information, Sample size (n) = 6 Mean (x̄) = 13.00 Standard deviation (s) = 7.155
Q: What is the independent variable using the table below showing the regression of assets and revenue?
A: Independent variable: The variable which does not influenced by other variables then it is called as…
Q: What is the Discrete Standard Deviation when sample size is 57 with a probability of 0.30?
A: From the provided information, Sample size (n) = 57 Probability (p) = 0.30
Q: The lengths of text messages are normally distributed with a population standard deviation of 3…
A: Solution
Q: What is the class width of the frequency distribution? Office salaries Frequency $35,000-$47,999…
A: We have given that the frequency distribution table.
Q: The average age of tennis players in French Open 2020 is 28.3 years and has a standard deviation of…
A: Mean(µ) = 28.3Standard deviations (σ) = 2.3X ~ N (µ, σ )= N(201, 22)
Q: Suppose that in a random sample of 600 employed Americans, there are 55 individuals who say that…
A:
Q: OB. 0.196 OC. 0.256 O D. 0
A: Given We can use Excel function CORREL command in Excel for correlation coefficient
Q: About 68% of possible sample means will be in the range between_____ and_____. About 95% of…
A: Suppose that you are interested in estimating the average number of miles per gallon of gasoline…
Q: The table below describes the number of cars in stock by Motor Traders. SUV Total Compact 50…
A: a) The probability that the car is a compact car is, Pcompact car=number of compact carsTotal cars…
Q: Jalue of home and life span are two variables that have been shown to have positive correlation but…
A: Correlation : The coefficient of correlation could be a applied math live of the strength of the…
Q: In an examination paper, there are 7 questions in part A out of which any 4 are Example 48. to be…
A:
Q: Question 5 In a right-skewed distribution? the mean is equal to the median. the mean is more than…
A: There are two types of skewness, they are positive and negative skewness. Positive skewness is also…
Q: a. What is the probability that the admission charge for a randomly selected movie will be less than…
A: Here Given Mean Admission charge for a movie= μ= RM 5.8 Standard Deviation =σ= RM 0.8And It…
Q: Suppose X is a single observation from a Beta(0,1) population where 0 > 0. a) For testing Ho:0 1,…
A: Hello! As you have posted more than 3 sub parts, we are answering the first 3 sub-parts. In case…
Q: Assume an in-control process has provided the following information: n = 4, i = 2.212, R = 0.012 1)…
A:
Q: You create a contingency table but you find that more than 20% of the cells have expected values of…
A: Given that we create a contingency table but we find that more than 20% of the cells have expected…
Q: exit poll of 2293 voters in the 2006 Ohio Senatorial election indicated that 44% voted for the…
A:
Q: Express the confidence interval (346.3, 655.9) in the form of ± ME.
A: here given , confidence Interval (346.3 , 655.9 ) upper limit = 655.9 lower limit = 346.3
Q: From a pack of standard cards numbered from 1 to 20, a card is drawn at hobilitu that the card drawn…
A: We have given that, Pack of standard cards numbered from 1 to 20 then the sample space (s) is, s =…
Q: The graph shows the number of errors made over time by a pianist practicing a new piece. 60 50 40 30…
A: Given problem Given that The graph shows the number of errors made over time by a pianist…
Q: distribution tab
A: frequency distribution table Class boundaries : subtracting 0.5 from lower class limit and adding…
Q: Consider the probability that more than 43 out of 130 people have been in a car accident. Assume the…
A: Given that n =130 ,p =0.97
Q: A climatologist has been collecting sulfur dioxide readings from a sample of monitoring sites…
A:
Q: 2. Suppose you are to choose among two suppliers of a certain chemical solution used in paint…
A: It is given that number of suppliers is 2 and density function f1(X) = 110 for 0≤X≤10f2(X) =…
Q: Which one of the following would be a possible p-value for the hypotheses: Ho : μ = 0 versus H1 : μ…
A: Here Given Hypothesis Ho : μ = 0 versus H1 : μ ≠ 0
Q: Example 47. committees of five can be formed? (b) How many of these has the head master? A school…
A:
Q: Theorem: FoY n attributes A, Ag,3 ...,An Then show That CA,,Aa, A3,. . An) I CA,tAg+ +CAn)- Cn-1N.
A:
Q: An elementary school teacher is interested in assessing how students' performance varies with the…
A: The sampling is the process that used to take sample from the population. The sampling is broadly…
Q: According to the American College Review, average tuition at a 4-year private college is $15,858…
A:
Q: Let f(y, A) be the density function of a continuous random variable, Y, where A is the parameter of…
A: (a) Parametric Family of densities: Due to the presence of one or more shape parameters, the density…
Q: 16% of the squirrels in Cititon Park are gray. What is the probability that, in a random sample of…
A:
Q: 1. Given with random samples of sizen selected from populations with means and variances, find the…
A:
Q: Analysis of variance is a technique used to conduct a hypothesis test to compare three or more…
A: Solution-: Analysis of variance is a technique used to conduct a hypothesis test to compare three or…
Q: The data show the chest size and weight of several bears. Find the regression equation, letting…
A: Given Use a significance level of 0.05.
Q: Based on the data shown below, calculate the regression line (each value to two decimal places) y =…
A: The table shows x and y values.
Q: (Competing patterns among coin flips) Suppose that Xn,n 2 1 are i.i.d. random variables with P(X1 =…
A: Increasing C creates a clearer curve than C increases. If you use a random sample of a one approach,…
Step by step
Solved in 2 steps with 2 images