A snack food manufacturer estimates that the variance of the number of grams of carbohydrates in servings of its tortilla chips is 1.23. A dietician is asked to test this claim and finds that a random sample of 16 servings has a variance of 1.16. At a 0.01, is there enough evidence to reject the manufacturer's claim? Assume the population is normally distributed. Complete parts (a) through (e) below. H2: o21.23 (Claim) Ha: o1.23 (b) Find the critical value(s) and identify the rejection region(s) The critical value(s) is(are) (Round to two decimal places as needed. Use a comma to separate answers as needed.) Choose the correct statement below and fill in the corresponding answer boxes. OA. The rejection region is x2 and x2> O B. The rejection regions are x < O C. The rejection region is x < (c) Find the standardized test statistic x (Round to two decimal places as needed.) (d) Decide whether to reject or fail to reject the null hypothesis, and (e) interpret the decision in the context of the original claim. Fill in the correct answers below. enough evidence to at the 1% level of significance to reject the manufacturer's claim that the variance of the number of grams of Ho. There carbohydrates in servings of its tortilla chips is 1.23. Click to select your answer(s). NOV tv 22 k Pro DO DII O00 O0D 20 F11 F9 F10 F8 F 7 F6 F5 F4 F3 F2 & # $
A snack food manufacturer estimates that the variance of the number of grams of carbohydrates in servings of its tortilla chips is 1.23. A dietician is asked to test this claim and finds that a random sample of 16 servings has a variance of 1.16. At a 0.01, is there enough evidence to reject the manufacturer's claim? Assume the population is normally distributed. Complete parts (a) through (e) below. H2: o21.23 (Claim) Ha: o1.23 (b) Find the critical value(s) and identify the rejection region(s) The critical value(s) is(are) (Round to two decimal places as needed. Use a comma to separate answers as needed.) Choose the correct statement below and fill in the corresponding answer boxes. OA. The rejection region is x2 and x2> O B. The rejection regions are x < O C. The rejection region is x < (c) Find the standardized test statistic x (Round to two decimal places as needed.) (d) Decide whether to reject or fail to reject the null hypothesis, and (e) interpret the decision in the context of the original claim. Fill in the correct answers below. enough evidence to at the 1% level of significance to reject the manufacturer's claim that the variance of the number of grams of Ho. There carbohydrates in servings of its tortilla chips is 1.23. Click to select your answer(s). NOV tv 22 k Pro DO DII O00 O0D 20 F11 F9 F10 F8 F 7 F6 F5 F4 F3 F2 & # $

MATLAB: An Introduction with Applications
6th Edition
ISBN:9781119256830
Author:Amos Gilat
Publisher:Amos Gilat
Chapter1: Starting With Matlab
Section: Chapter Questions
Problem 1P

Related questions
Question
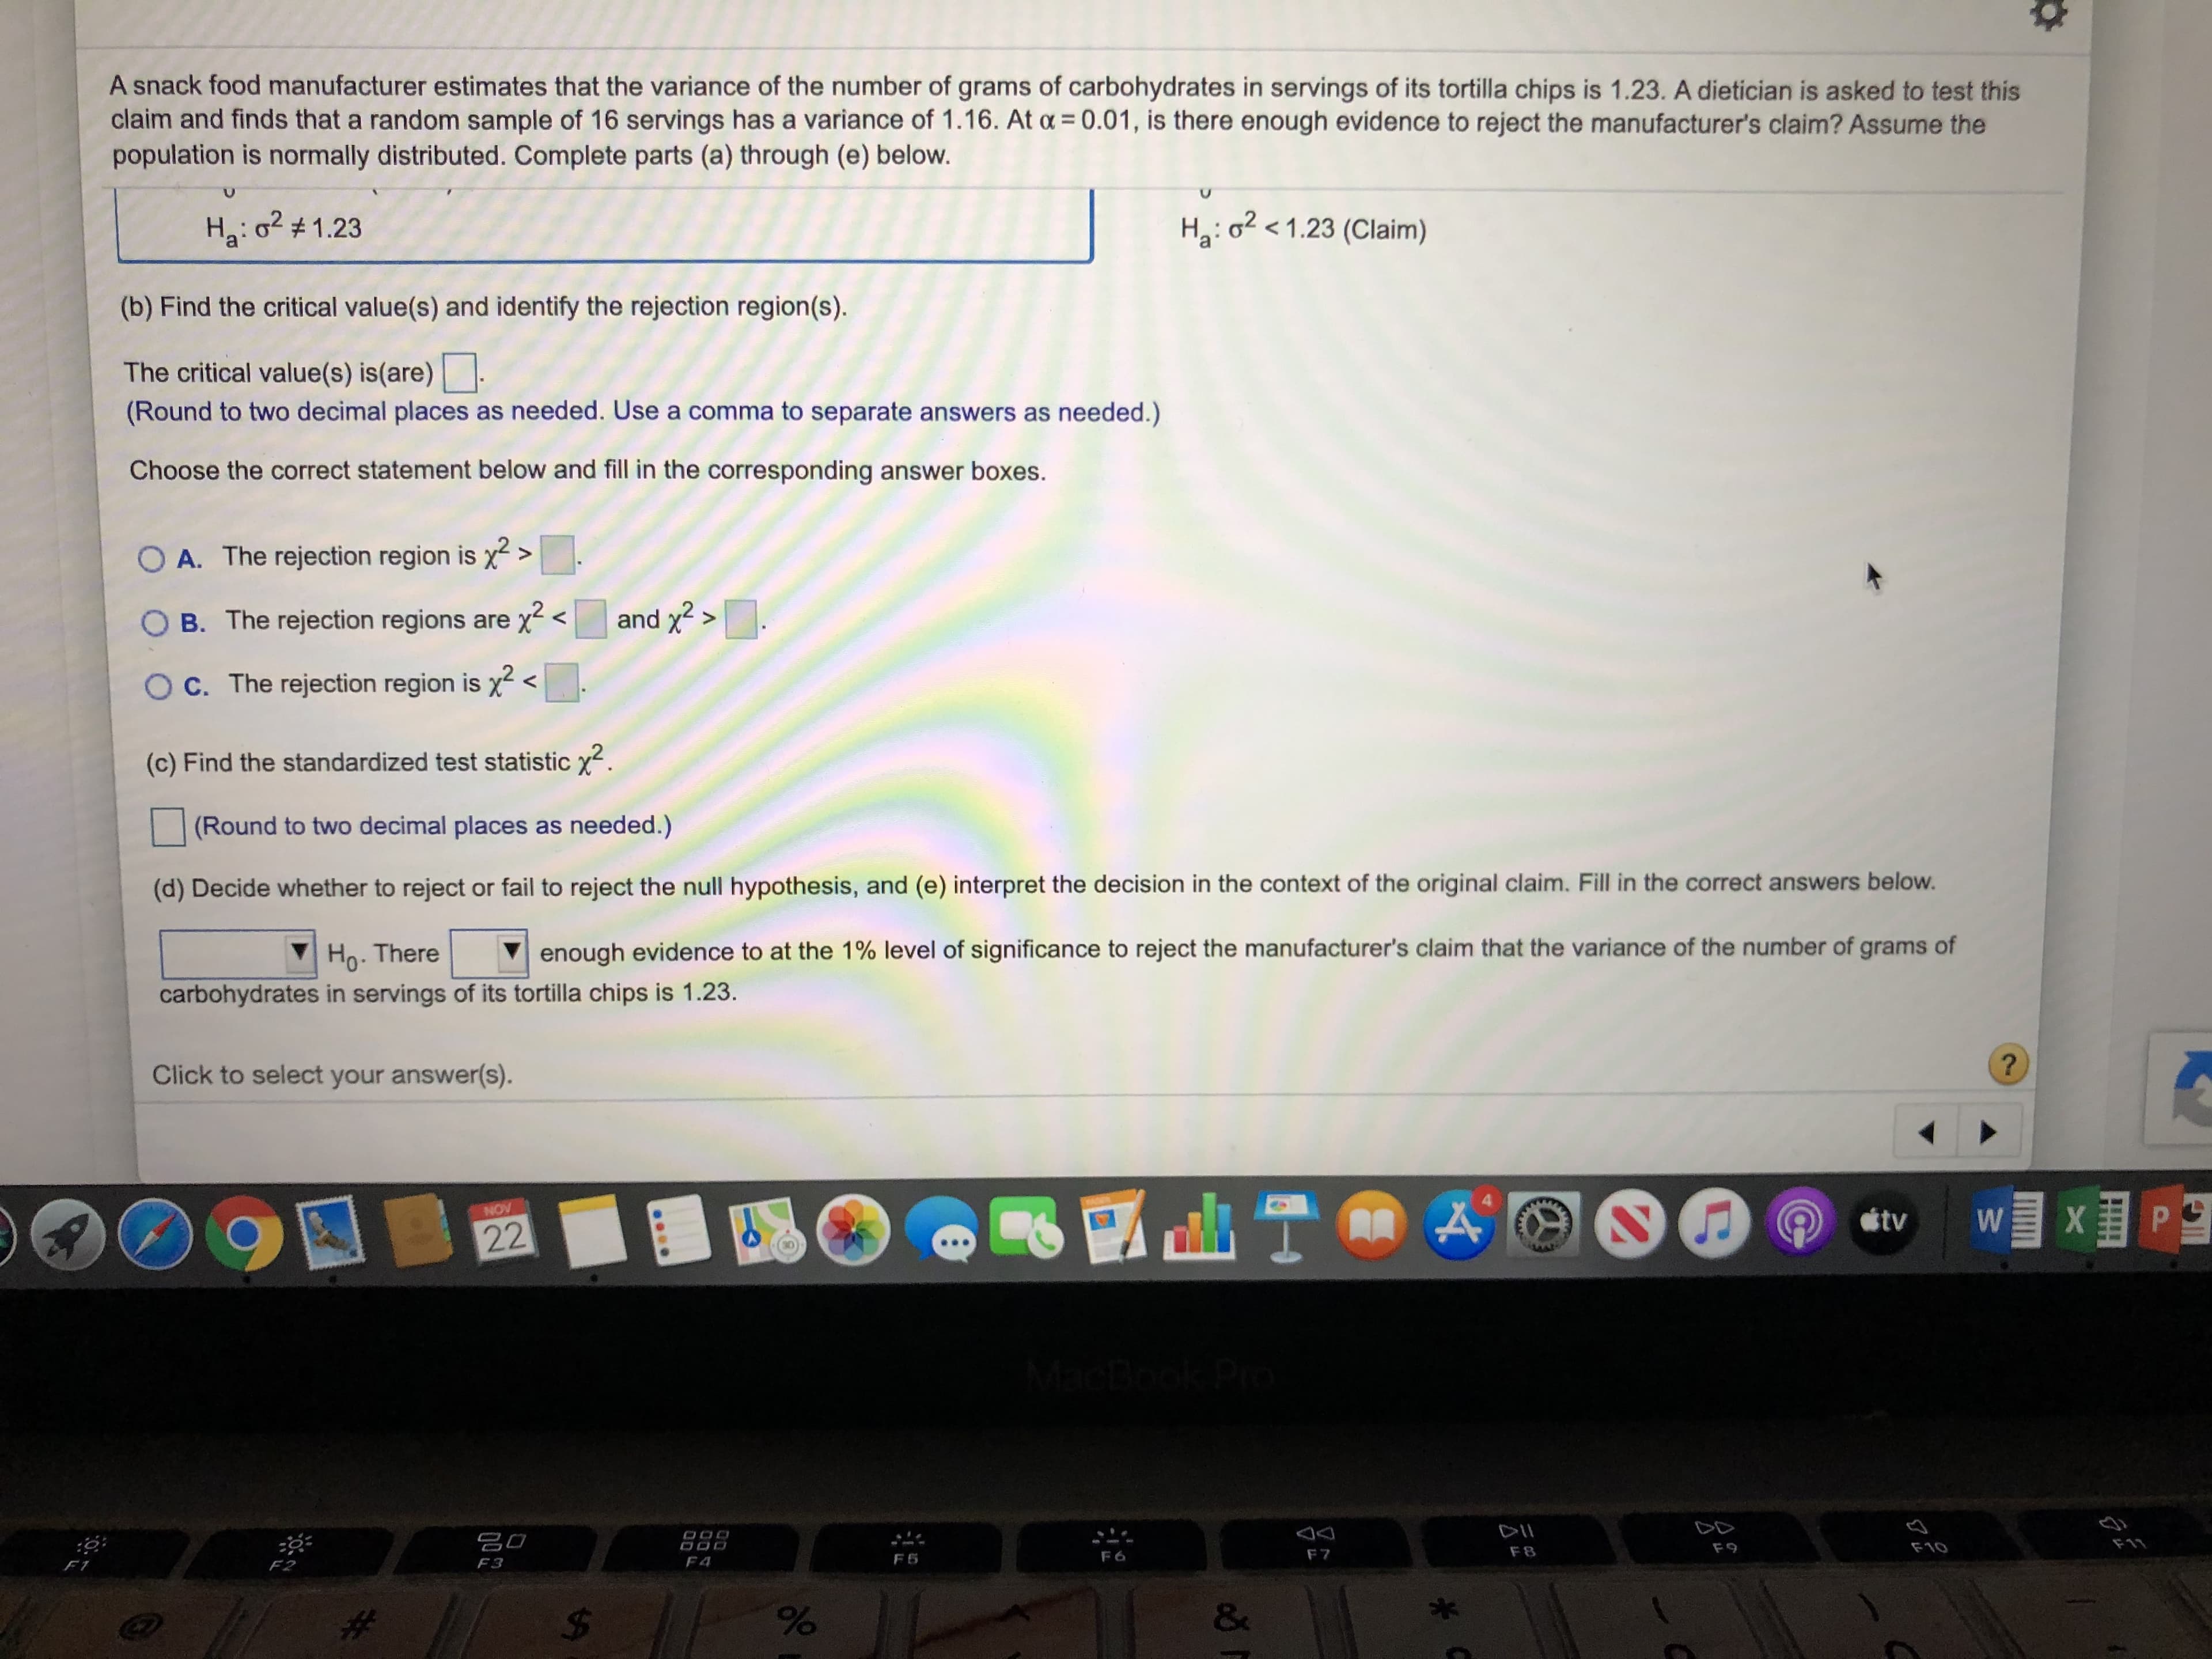
Transcribed Image Text:A snack food manufacturer estimates that the variance of the number of grams of carbohydrates in servings of its tortilla chips is 1.23. A dietician is asked to test this
claim and finds that a random sample of 16 servings has a variance of 1.16. At a 0.01, is there enough evidence to reject the manufacturer's claim? Assume the
population is normally distributed. Complete parts (a) through (e) below.
H2: o21.23 (Claim)
Ha: o1.23
(b) Find the critical value(s) and identify the rejection region(s)
The critical value(s) is(are)
(Round to two decimal places as needed. Use a comma to separate answers as needed.)
Choose the correct statement below and fill in the corresponding answer boxes.
OA. The rejection region is x2
and x2>
O B. The rejection regions are x <
O C. The rejection region is x
<
(c) Find the standardized test statistic x
(Round to two decimal places as needed.)
(d) Decide whether to reject or fail to reject the null hypothesis, and (e) interpret the decision in the context of the original claim. Fill in the correct answers below.
enough evidence to at the 1% level of significance to reject the manufacturer's claim that the variance of the number of grams of
Ho. There
carbohydrates in servings of its tortilla chips is 1.23.
Click to select your answer(s).
NOV
tv
22
k Pro
DO
DII
O00
O0D
20
F11
F9
F10
F8
F 7
F6
F5
F4
F3
F2
&
#
$
Expert Solution
This question has been solved!
Explore an expertly crafted, step-by-step solution for a thorough understanding of key concepts.

This is a popular solution!

Trending now
This is a popular solution!

Step by step
Solved in 2 steps with 2 images

Recommended textbooks for you
MATLAB: An Introduction with Applications
Statistics
ISBN:
9781119256830
Author:
Amos Gilat
Publisher:
John Wiley & Sons Inc

Probability and Statistics for Engineering and th…
Statistics
ISBN:
9781305251809
Author:
Jay L. Devore
Publisher:
Cengage Learning

Statistics for The Behavioral Sciences (MindTap C…
Statistics
ISBN:
9781305504912
Author:
Frederick J Gravetter, Larry B. Wallnau
Publisher:
Cengage Learning
MATLAB: An Introduction with Applications
Statistics
ISBN:
9781119256830
Author:
Amos Gilat
Publisher:
John Wiley & Sons Inc
Probability and Statistics for Engineering and th…
Statistics
ISBN:
9781305251809
Author:
Jay L. Devore
Publisher:
Cengage Learning
Statistics for The Behavioral Sciences (MindTap C…
Statistics
ISBN:
9781305504912
Author:
Frederick J Gravetter, Larry B. Wallnau
Publisher:
Cengage Learning

Elementary Statistics: Picturing the World (7th E…
Statistics
ISBN:
9780134683416
Author:
Ron Larson, Betsy Farber
Publisher:
PEARSON

The Basic Practice of Statistics
Statistics
ISBN:
9781319042578
Author:
David S. Moore, William I. Notz, Michael A. Fligner
Publisher:
W. H. Freeman

Introduction to the Practice of Statistics
Statistics
ISBN:
9781319013387
Author:
David S. Moore, George P. McCabe, Bruce A. Craig
Publisher:
W. H. Freeman