A study asked respondents, "If ever married, how old were you when you first married?" The results are summarized in the technology excerpt that follows. Complete parts (a) through (d) belo One-Sample T: AGEWED Mean StDev SE Mean Variable N 95.0% CI AGEWED 26970 22.530 4.712 0.029 (22.474, 22.586) E Click the icon to view the table of critical t-values. (a) Use the summary to determine the point estimate of the population mean and margin of error for the confidence interval. x = 22.530 (Type an integer or a decimal. Do not round.) E = 0.056 (Type an integer or a decimal. Do not round.) (b) Interpret the confidence interval. A. One can be 95% confident that the mean age of people when first married is between 22.474 and 22.586 years. O B. There is a 95% probability that the mean age of people when first married is between 22.474 and 22.586 years. O C. There is a 95% probability that the mean age of people when first married is 22.530 years. O D. One can be 95% confident that the mean age of people when first married is 22.530 years. (c) Verify the results by computing a 95% confidence interval with the information provided. Begin with the lower bound. 4.712 22.530 1.96 • = 22.474 V 26970 (Round to three decimal places as needed.) Next find the upper bound. 4.712
A study asked respondents, "If ever married, how old were you when you first married?" The results are summarized in the technology excerpt that follows. Complete parts (a) through (d) belo One-Sample T: AGEWED Mean StDev SE Mean Variable N 95.0% CI AGEWED 26970 22.530 4.712 0.029 (22.474, 22.586) E Click the icon to view the table of critical t-values. (a) Use the summary to determine the point estimate of the population mean and margin of error for the confidence interval. x = 22.530 (Type an integer or a decimal. Do not round.) E = 0.056 (Type an integer or a decimal. Do not round.) (b) Interpret the confidence interval. A. One can be 95% confident that the mean age of people when first married is between 22.474 and 22.586 years. O B. There is a 95% probability that the mean age of people when first married is between 22.474 and 22.586 years. O C. There is a 95% probability that the mean age of people when first married is 22.530 years. O D. One can be 95% confident that the mean age of people when first married is 22.530 years. (c) Verify the results by computing a 95% confidence interval with the information provided. Begin with the lower bound. 4.712 22.530 1.96 • = 22.474 V 26970 (Round to three decimal places as needed.) Next find the upper bound. 4.712

Glencoe Algebra 1, Student Edition, 9780079039897, 0079039898, 2018
18th Edition
ISBN:9780079039897
Author:Carter
Publisher:Carter
Chapter10: Statistics
Section10.6: Summarizing Categorical Data
Problem 30PPS

Related questions
Question
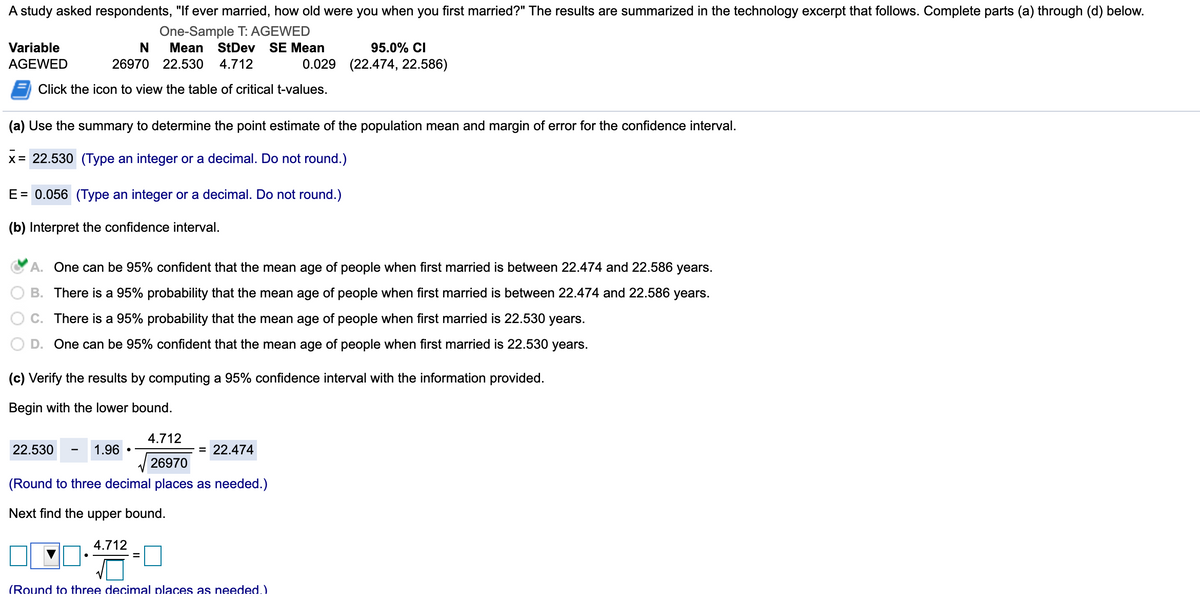
Transcribed Image Text:A study asked respondents, "If ever married, how old were you when you first married?" The results are summarized in the technology excerpt that follows. Complete parts (a) through (d) below.
One-Sample T: AGEWED
Mean
Variable
StDev SE Mean
95.0% CI
AGEWED
26970 22.530
4.712
0.029 (22.474, 22.586)
Click the icon to view the table of critical t-values.
(a) Use the summary to determine the point estimate of the population mean and margin of error for the confidence interval.
x= 22.530 (Type an integer or a decimal. Do not round.)
E= 0.056 (Type an integer or a decimal. Do not round.)
(b) Interpret the confidence interval.
A. One can be 95% confident that the mean age of people when first married is between 22.474 and 22.586 years.
B. There is a 95% probability that the mean age of people when first married is between 22.474 and 22.586 years.
C. There is a 95% probability that the mean age of people when first married is 22.530 years.
D. One can be 95% confident that the mean age of people when first married is 22.530 years.
(c) Verify the results by computing a 95% confidence interval with the information provided.
Begin with the lower bound.
4.712
22.530
1.96
= 22.474
26970
(Round to three decimal places as needed.)
Next find the upper bound.
4.712
%3D
(Round to three decimal places as needed.)
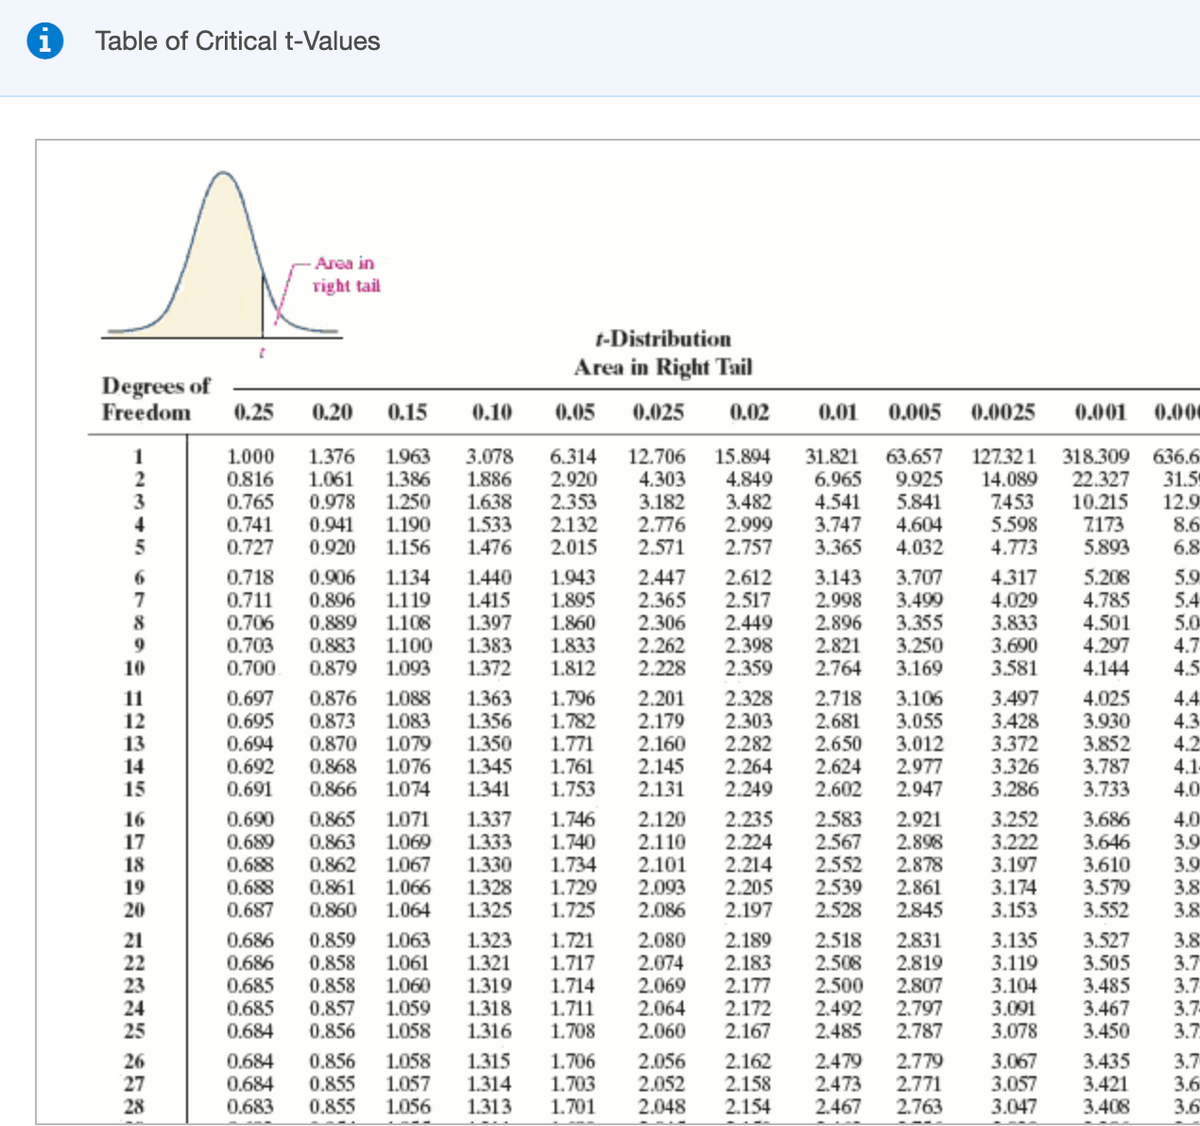
Transcribed Image Text:Table of Critical t-Values
Area in
right tail
t-Distribution
Area in Right Tail
Degrees of
Freedom
0.25
0.20
0.15
0.10
0.05
0.025
0.02
0.01
0.005
0.0025
0.001
0.00
1.376
1.061
0.978
1.963
1.386
1.250
1.190
1.156
3.078
15.894
4.849
3.482
31.821
6.965
4.541
3.747
3.365
63.657
9.925
5.841
4.604
4.032
1
1.000
0.816
0.765
0.741
6.314
2.920
2.353
2.132
2.015
12.706
4.303
3.182
127.321
14.089
7.453
5.598
4.773
318.309 636.6
22.327
10.215
7173
5.893
2
31.5
1.886
1.638
1.533
1.476
12.9
8.6
6.8
2.999
2.757
4
0.941
0.920
2.776
5
0.727
2.571
0.718
0.711
0.706
1.440
1.415
1.397
1.383
1.372
1.943
1.895
1.860
1.833
1.812
2.612
2.517
2.449
2.398
2.359
5.9
5.4
5.0
3.707
3.499
0.906
0.896
0.889
0.883
1.134
1.119
1.108
1.100
1.093
2.447
2.365
2.306
2.262
2.228
3.143
2.998
2.896
2.821
2.764
4.317
4.029
3.833
3.690
3.581
5.208
4.785
4.501
4.297
4.144
7
0.703
0.700
3.355
3.250
3.169
4.7
10
0.879
4.5
1.796
1.782
0.876
0.873
0.870
0.868
0.866
1.363
1.356
1.350
1.345
2.201
2.179
2.160
2.145
2.131
2.328
2.303
2.282
2.264
2.249
2.718
2.681
2.650
2.624
2.602
3.106
3.055
11
12
13
14
15
3.497
3.428
3.372
3.326
3.286
4.025
3.930
3.852
3.787
3.733
0.697
0.695
0.694
0.692
0.691
1.088
1.083
1.079
1.076
1.771
1.761
1.753
3.012
2.977
2.947
4.4
4.3
4.2
4.1-
4.0
1.074
1.341
1.337
1.333
1.330
1.328
1.325
2.583
2.567
2.552
2.539
2.528
2.921
2.898
3.252
3.222
3.197
3.174
3.153
0.690
0.689
0.865
0.863
0.862
0.861
0.860
1.071
1.069
1.067
1.066
1.064
2.235
2.224
2.214
2.205
2.197
3.686
16
17
18
19
20
0.688
0.688
0.687
1.746
1.740
1.734
1.729
1.725
2.120
2.110
2.101
2.093
2.086
2.878
2.861
2.845
3.646
3.610
3.579
3.552
4.0
3.9
3.9
3.8
3.8
0.686
0.686
0.685
0.685
0.684
1.721
1.717
1.714
1.711
1.708
2.080
2.074
2.069
2.064
2.060
2.189
2.183
2.177
2.172
2.167
2.518
2.508
2.500
2.492
2.485
3.8
3.7
3.7
3.7-
3.7
2.831
3.135
3.119
3.104
3.091
3.078
3.527
21
22
23
24
25
0.859
0.858
0.858
0.857
0.856
1.063
1.061
1.060
1.059
1.058
1.323
1.321
1.319
1.318
1.316
2.819
2.807
2.797
2.787
3.505
3.485
3.467
3.450
0.856
0.855
0.855
1.058
1.057
1.056
2.056
2.052
2.162
2.158
2.154
2.479
2.473
2.467
3.067
3.057
3.047
3.7
3.6
3.6
3.435
26
27
28
0.684
0.684
0.683
1.315
1.314
1.313
1.706
1.703
1.701
2.779
2.771
2.763
3.421
3.408
2.048
Expert Solution
This question has been solved!
Explore an expertly crafted, step-by-step solution for a thorough understanding of key concepts.

This is a popular solution!

Trending now
This is a popular solution!

Step by step
Solved in 2 steps

Knowledge Booster


Learn more about
Need a deep-dive on the concept behind this application? Look no further. Learn more about this topic, statistics and related others by exploring similar questions and additional content below.Recommended textbooks for you
Glencoe Algebra 1, Student Edition, 9780079039897…
Algebra
ISBN:
9780079039897
Author:
Carter
Publisher:
McGraw Hill
Glencoe Algebra 1, Student Edition, 9780079039897…
Algebra
ISBN:
9780079039897
Author:
Carter
Publisher:
McGraw Hill