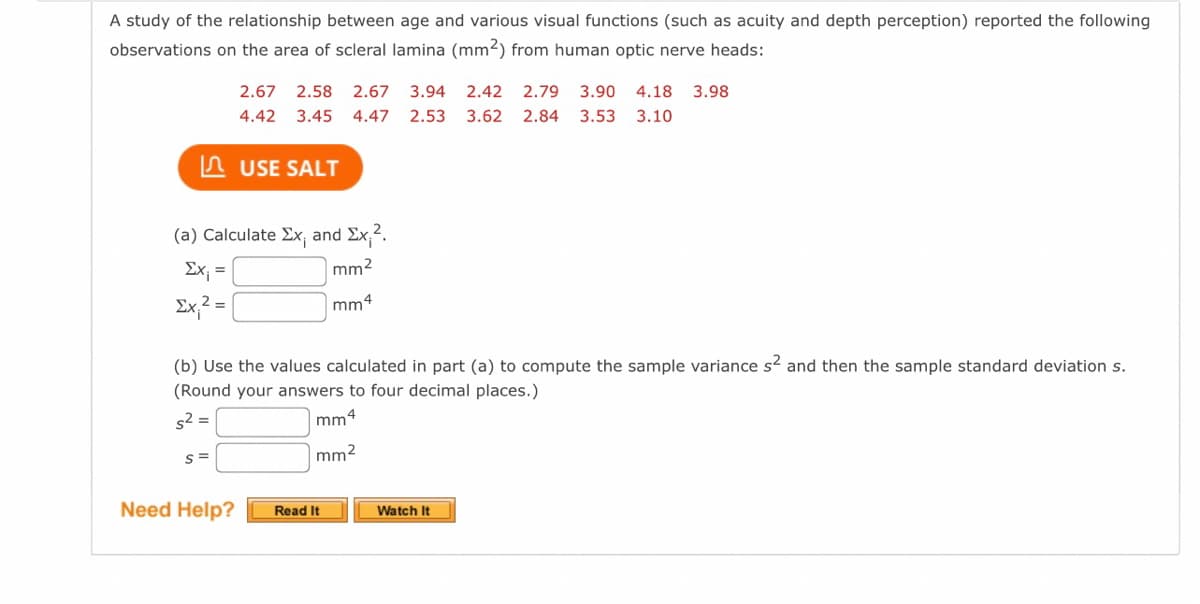
A study of the relationship between age and various visual functions (such as acuity and depth perception) reported the following observations on the area of scleral lamina (mm2) from human optic nerve heads: 2.67 2.58 2.67 3.94 2.42 2.79 3.90 4.18 3.98 4.42 3.45 4.47 2.53 3.62 2.84 3.53 3.10 A USE SALT (a) Calculate Ex, and Ex,2. Ex; = mm2 Ex,? = ( mm4 (b) Use the values calculated in part (a) to compute the sample variance s and then the sample standard deviation s. (Round your answers to four decimal places.) s2 = mm4 mm2


Q: In an article in IEEE Transactions on Instrumentation and Measurement (2001, Vol. 50, pp. 986-990),…
A:
Q: IN what area is the alpha level represented in the NDC? *
A: Here AS PER POLICY I HAVE CALCULATED FIRST MAIN QUESTION PLZ REPOST FOR REMAINING PARTS
Q: Wild irises are beautiful flowers found throughout the United States, Canada, and northern Europe.…
A: Since you have posted a question with multiple sub-parts, we will solve first three sub-parts for…
Q: An articde in the ACI Materials Journal (val. 84, 1987, pp. 213-216) describes several experiments…
A: F test is used to make conclusions in the anova table. Anova table is used to measure the mean…
Q: An artide in the IEEE Transactions on Components, Hybrids, and Manufacturing Technology (Vol. 15,…
A:
Q: A artide in the ACI Materials Joumal (vol. 4, 1987. pp. 213-216) describes several experiments…
A:
Q: The accompanying data below represent the miles per gallon of a random sample of cars with a…
A: Given : 32.7 35.9 38.0 38.6 40.1 42.0 34.4 36.2 38.1 38.9 40.6 42.8 34.8 37.3 38.3 39.2 41.4…
Q: The following data was collected on pupil dilation diameters from a new test being considered for…
A:
Q: Suppose a biologist studying the mechanical limitations of growth among different species of tulips…
A: Formula : IQR = Q3-Q1
Q: A study of the properties of metal plate-connected trusses used for roof support yielded the…
A:
Q: Wild irises are beautiful flowers found throughout the United States, Canada, and northern Europe.…
A: Given: Measurements of sepal length in centimetres from random samples of Iris setose (I), Iris…
Q: The Following table presents measurements of head roughness (in nanometers). Diameter…
A: a. Excel Procedure for ANOVA: Enter the data for Diameter 16, 28 and 36 in Excel sheet.Go to…
Q: In an article in IEEE Transactions on Instrumentation and Measurement (2001, Vol. 50, pp. 986-990),…
A: Given that Supply Voltage(v) Current without Electronic(mA) 0.66 7.32 1.32 12.22 1.98 16.34…
Q: ASK TOur Teacher The propagation of fatigue cracks in various aircraft parts has been the subject of…
A:
Q: The spike stature of the plants grown from the seeds of the porcine separates (Dactylis glomerata L)…
A: Given nX=11, nY=10 X (x-x__)2 Y (y-y__)2 5 1 12 3.61 6 0 9 1.21 8 4 11 0.81 7 1 9 1.21…
Q: In Applied Spectroscopy, the infrared reflectance spectra properties of a viscous liquid used in the…
A: Multiple regression: If the data set is multiple, then linear regression best suits the data. The…
Q: The accompanying data on cube compressive strength (MPa) of concrete specimens appeared in the…
A: * SOLUTION :- (B)
Q: An experiment was conducted in order to determine if cerebral blood flow in human beings can be…
A: We need to fit the given dataset into a quadratic equation of the form: y=a+bx+cx2 and then…
Q: Grip is applied to produce normal surface forces that compress the object being gripped. The…
A: Given: n = 42 Formula Used:
Q: Managers of an outdoor coffee stand in Coast City are examining the relationship between (hot)…
A:
Q: The table below refers to a survey of senior high school students in Dayton, Ohio. Cigarette use Yes…
A: Obtain the value of the test statistic. The value of the test statistic is obtained below:
Q: An article in the ACI Materials Journal (Vol. 84, 1987, pp. 213-216) describes several experiments…
A:
Q: A study of the relationship between age and variousvisual functions (such as acuity and depth…
A: a) The summation values are calculated as follows:
Q: An article in the ACI Materials Journal (Vol. 84, 1987, pp. 213-216) describes several experiments…
A: There are 4 independent samples which follows normal distribution. We have to test whether there is…
Q: Wild irises are beautiful flowers found throughout the United States, Canada, and northern Europe.…
A: The null and the alternative hypotheses are;Null hypothesis: All means of sepal length of different…
Q: Given the data in the following table for wave-soldering nonconformities, determine if there are any…
A: The null hypothesis is a simple statement about the value of the population parameter which is…
Q: The following data were taken from a research article in the Canadian Journal of Fisheries and…
A: 1. The null and alternative hypothesis is given by, H0:μ1-μ2=0Ha:μ1-μ2≠0 2. The sample for LSL is 10…
Q: 4. An article in the Journal of Environmental Engineering (1989, Vol. 115(3), pp. 608-619) reported…
A: Steps to construct scatter plot in Excel: Enter the data for x and y in Excel sheet>Select the…
Q: An article contained the following observations on degree of polymerization for paper specimens for…
A: Mean is the measure used to determine the average measure of the data set. Standard deviation is…
Q: As in the previous question, fill in the blank to name the test, but also sa of the curve that…
A: Note: Hi there! Thank you for posting the question. As you have posted multiple questions, as per…
Q: An artidle in the IEEE Transactions on Components, Hybrids, and Manufacturing Technolo experiment in…
A: By using one way ANOVA for a single factor,
Q: Wild irises are beautiful flowers found throughout the United States, Canada, and northern Europe.…
A: Given Information : Wild irises are beautiful flowers found throughout the United States, Canada,…
Q: The table below shows the data obtained from compressive strength test performed in materials…
A:
Q: In Applied Spectroscopy, the infrared reflectance spectra properties of a viscous liquid used in the…
A: Excel Procedure: Enter y and x1, x2 in Excel Go to Data Click on Data Analysis……..>…
Q: Wild irises are beautiful flowers found throughout the United States, Canada, and northern Europe.…
A: Given Information : Wild irises are beautiful flowers found throughout the United States, Canada,…
Q: Use the standard error to construct a approximate prediction interval for Y using an alpha of 5%.…
A:
Q: An article in the Food Technology Journal (1956, Vol. 10, pp. 39-42) described a study on the…
A: a) Solution: Since p-value<α, H0 is rejected. Some of the groups' averages consider to be not…
Q: The data show the hourly earnings (in dollars) of a sample of 25 railroad equipment manufacturers.…
A: Given,sample size(n)=25Arrange the given data in ascending order. 13.85 , 13.90 , 14.20 , 14.35 ,…
Q: An article in the ACI Materials Journal (Vol. 84, 1987, pp. 213-216) describes several experiments…
A: Given :
Q: Wild irises are beautiful flowers found throughout the United States, Canada, and northern Europe.…
A: Given information- Measurements of sepal length in centimeters from random samples of Iris setosa…
Q: Compute both nonparametric and parametric 95% interval estimates for the median of the following…
A: Obtain the 95% parametric confidence interval estimate for median: The data values of Granodiorite…
Q: The accompanying data below represent the miles per gallon of a random sample of cars with a…
A: Given information- We have given data represent the miles per gallon of a random sample of cars with…
Q: In a study examining the effect of alcohol on reaction time, Liguori and Robinson (2001) found that…
A: Given that; μ=400 msecσ=40x¯=422n=25 a. The null and alternative hypothesis is given by; H0:…
Q: The article "Effect of Microstructure and Weathering on the Strength Anisotropy of Porous Rhyolite"…
A:
Q: An article in the ACI Materials Journal (Vol. 84, 1987, pp. 213-216) describes several experiments…
A:
Q: Lactation promotes a temporary loss of bone mass to provide adequate amounts of calcium for milk…
A: Let μD represents the true average difference between total body bone mineral content during…
Q: Just part d. Not a through c. The article “Study on the Life Distribution of Microdrills” (J.…
A: Introduction: We have helped you solve part d of the question.
Q: a. Do the results indicate a significantly higher estr- mated speed for the "smashed into" group?…
A: The solution is given as follows-
Q: the 2015 AFC Championship game, there was a charge that the New England Patriots underinflated…
A: Given that
Q: Ina certain type of metal test specimen, the normal stress on a specimen is known to be functionally…
A: The independent variable is Normal Stress. The dependent variable is Shear Resistance. We have to…

Step by step
Solved in 3 steps with 1 images

- A study of the relationship between age and various visual functions (such as acuity and depth perception) reported the following observations on the area of scleral lamina (mm2) from human optic nerve heads: 2.84 2.63 2.76 3.75 2.28 2.64 3.94 4.11 3.80 4.27 3.49 4.51 2.40 3.59 2.72 3.55 3.02 (a) Calculate Σxi and Σxi2. Σxi = ? mm2 Σxi2 = ? mm4 (b) Use the values calculated in part (a) to compute the sample variance s2 and then the sample standard deviation s. (Round your answers to four decimal places.) s2 = ? mm4 s = ? mm2A study of the relationship between age and various visual functions (such as acuity and depth perception) reported the following observations on the area of scleral lamina (mm2) from human optic nerve heads: 2.79 2.66 2.80 3.92 2.28 2.81 4.02 4.16 3.95 4.26 3.51 4.61 2.37 3.66 2.72 3.64 2.96 (a) Calculate Σxi and Σxi2. (Round Σxi2 to two decimal places.) Σxi = mm2 Σxi2 = mm4 (b) Use the values calculated in part (a) to compute the sample variance s2 and then the sample standard deviation s. (Round your answers to three decimal places.) s2 = mm4 s = mm2The spike stature of the plants grown from the seeds of the porcine separates (Dactylis glomerata L) collected from the University campus and İbradı Eynif pasture are given below. In this plant, compare whether there is a difference between regions in terms of spike height. Virgo Height (cm) Data obtained from plants collected from university campus 5 6 8 7 8 6 5 5 4 6 6 Data obtained from plants collected from Eynif pasture 12 9 11 9 9 11 9 10 11 10 Note: Your results interpretation according to two different possibilities (Do it separately, assuming that it is 0.07 and 0.04).
- Dioxin Researchers have linked an increase in the inci-dence of breast cancer in Italy to dioxin released by an industrial accident in 1976. The study identified 981women who lived near the site of the accident and were under age 40 at the time. Fifteen of the women had devel-oped breast cancer at an unusually young average age of 45. Medical records showed that they had heightened con-centrations of dioxin in their blood and that each tenfold increase in dioxin level was associated with a doubling ofthe risk of breast cancer. (Science News, Aug. 3, 2002)Evans conducted a study to determine if the frequency and characteristics of pediatric problems in elderly patients with diabetes present differences with respect to patients of the same age, but without diabetes. The individuals studied, interned in a clinic, were between 70 and 90 years old. Among the researchers' findings are the following statistics. with respect to the scores on the deep tendon reflexes meters:Sample without Diabetes: 79 / 2.1 / 1.1With Diabetes: 74 / 1.6 / 1.2Is it possible to conclude, based on the data, that, on average, diabetic patients they have reduced deep tendon reflexes in comparison with patients without diabetes of the same age?The value of Young’s modulus (GPa) was determined forcast plates consisting of certain intermetallic substrates,resulting in the following sample observations (“Strengthand Modulus of a Molybdenum-Coated Ti-25Al-10Nb-3U-1Mo Intermetallic,” J. of Materials Engr.and Performance, 1997: 46–50):116.4 115.9 114.6 115.2 115.8a. Calculate x and the deviations from the mean.b. Use the deviations calculated in part (a) to obtain thesample variance and the sample standard deviation.c. Calculate s2 by using the computational formula forthe numerator Sxx.d. Subtract 100 from each observation to obtain a sampleof transformed values. Now calculate the samplevariance of these transformed values, and compare itto s2 for the original data.
- Dyslexia refers to a specific reading disability that affects 10% to 15% of the general population. A dyslexic child is defined as a child of normal or above-normal intelligence with no known organic behavioural disorders who, despite normal schooling, shows a reading lag of at least two years. A researcher proposed that dyslexia was the result of a complex visual deficit that could be immediately corrected by simply putting a blue plastic overlay on the reading material. To test this, 100 dyslexic children were randomly assigned to one of two groups, one of which read from pages with a clear plastic overlay and the other of which read from pages with a blue plastic overlay. The dependent variable was percentage correct on a multiple-choice reading comprehension test. a) Is this an observational study or an experiment? Explain your choice. b) Why did the researcher use a clear overlay as one of the treatment groups instead of just having the children read the passage without an…Dyslexia refers to a specific reading disability that affects 10% to 15% of the general population. A dyslexic child is defined as a child of normal or above-normal intelligence with no known organic behavioural disorders who, despite normal schooling, shows a reading lag of at least two years. A researcher proposed that dyslexia was the result of a complex visual deficit that could be immediately corrected by simply putting a blue plastic overlay on the reading material. To test this, 100 dyslexic children were randomly assigned to one of two groups, one of which read from pages with a clear plastic overlay and the other of which read from pages with a blue plastic overlay. The dependent variable was percentage correct on a multiple-choice reading comprehension test. What assumptions for the hypothesis test would need to be conducted for a one sample t test? Which data on spss would i need to look at for the assumptions?A paper investigated the driving behavior of teenagers by observing their vehicles as they left a high school parking lot and then again at a site approximately 1 2 mile from the school. Assume that it is reasonable to regard the teen drivers in this study as representative of the population of teen drivers. Amount by Which Speed Limit Was Exceeded MaleDriver FemaleDriver 1.3 -0.1 1.3 0.4 0.9 1.1 2.1 0.7 0.7 1.1 1.3 1.2 3 0.1 1.3 0.9 0.6 0.5 2.1 0.5 (a) Use a .01 level of significance for any hypothesis tests. Data consistent with summary quantities appearing in the paper are given in the table. The measurements represent the difference between the observed vehicle speed and the posted speed limit (in miles per hour) for a sample of male teenage drivers and a sample of female teenage drivers. (Use μmales − μfemales.Round your test statistic to two decimal places. Round your degrees of freedom down to the nearest whole number. Round your p-value to…
- A paper investigated the driving behavior of teenagers by observing their vehicles as they left a high school parking lot and then again at a site approximately 1 2 mile from the school. Assume that it is reasonable to regard the teen drivers in this study as representative of the population of teen drivers. Amount by Which Speed Limit Was Exceeded MaleDriver FemaleDriver 1.2 -0.1 1.4 0.4 0.9 1.1 2.1 0.7 0.7 1.1 1.3 1.2 3 0.1 1.3 0.9 0.6 0.5 2.1 0.5 (a) Use a .01 level of significance for any hypothesis tests. Data consistent with summary quantities appearing in the paper are given in the table. The measurements represent the difference between the observed vehicle speed and the posted speed limit (in miles per hour) for a sample of male teenage drivers and a sample of female teenage drivers. (Use μmales − μfemales.Round your test statistic to two decimal places. Round your degrees of freedom down to the nearest whole number. Round your p-value to…A study was conducted to examine if children with autism spectrum disorder (ASD) had higher prenatal exposure to air pollution, specifically particulate matter < 2.5 g in diameter (PM2.5). Researchers obtained birth records of all children born in Los Angeles between 2000 and 2008 and linked these to the Department of Developmental Services records to determine if any of those subjects had been diagnosed with ASD or not. They used the birth addresses given in the birth records to determine the average daily PM2.5 for the third trimester for each child. The standard deviation for PM2.5 among ASD subjects was found to be 34.6 and for non-ASD subjects was 16.8. Assume PM2.5 is normally distributed. 4a. What was the study design? * Randomized Clinical Trial (RCT) * Case Report * Nested Case-Control Study * Case-Control Study * cross-sectional study Cohort Study 4B. What are the null and alternative hypotheses? 4c. What type of statistical test would you use to analyze the…The contingency table shows the results of a random sample of former smokers by the number of times they tried to quit smoking before they were habit-free and gender. At α=0.10, can you conclude that the number of times they tried to quit before they were habit-free is related to gender? Perform the indicated chi-square independence test by completing parts (a) through (e) below.